
Over the past decade or so, football has become a sport that demands more and more running. Pressing high up the pitch to win the ball back quickly, then transitioning straight into attack, has become the mainstream approach across Europe's top leagues. Various analyses have repeatedly reported that high-intensity distance and sprints have grown faster than total distance covered.
Along with this shift, "how much a team runs" stopped being treated as a simple measure of effort and started being read as part of a team's tactical identity. Naturally, this brought along the belief that teams who run more and press harder eventually win.
Was the 2025 K League 1 season the same?
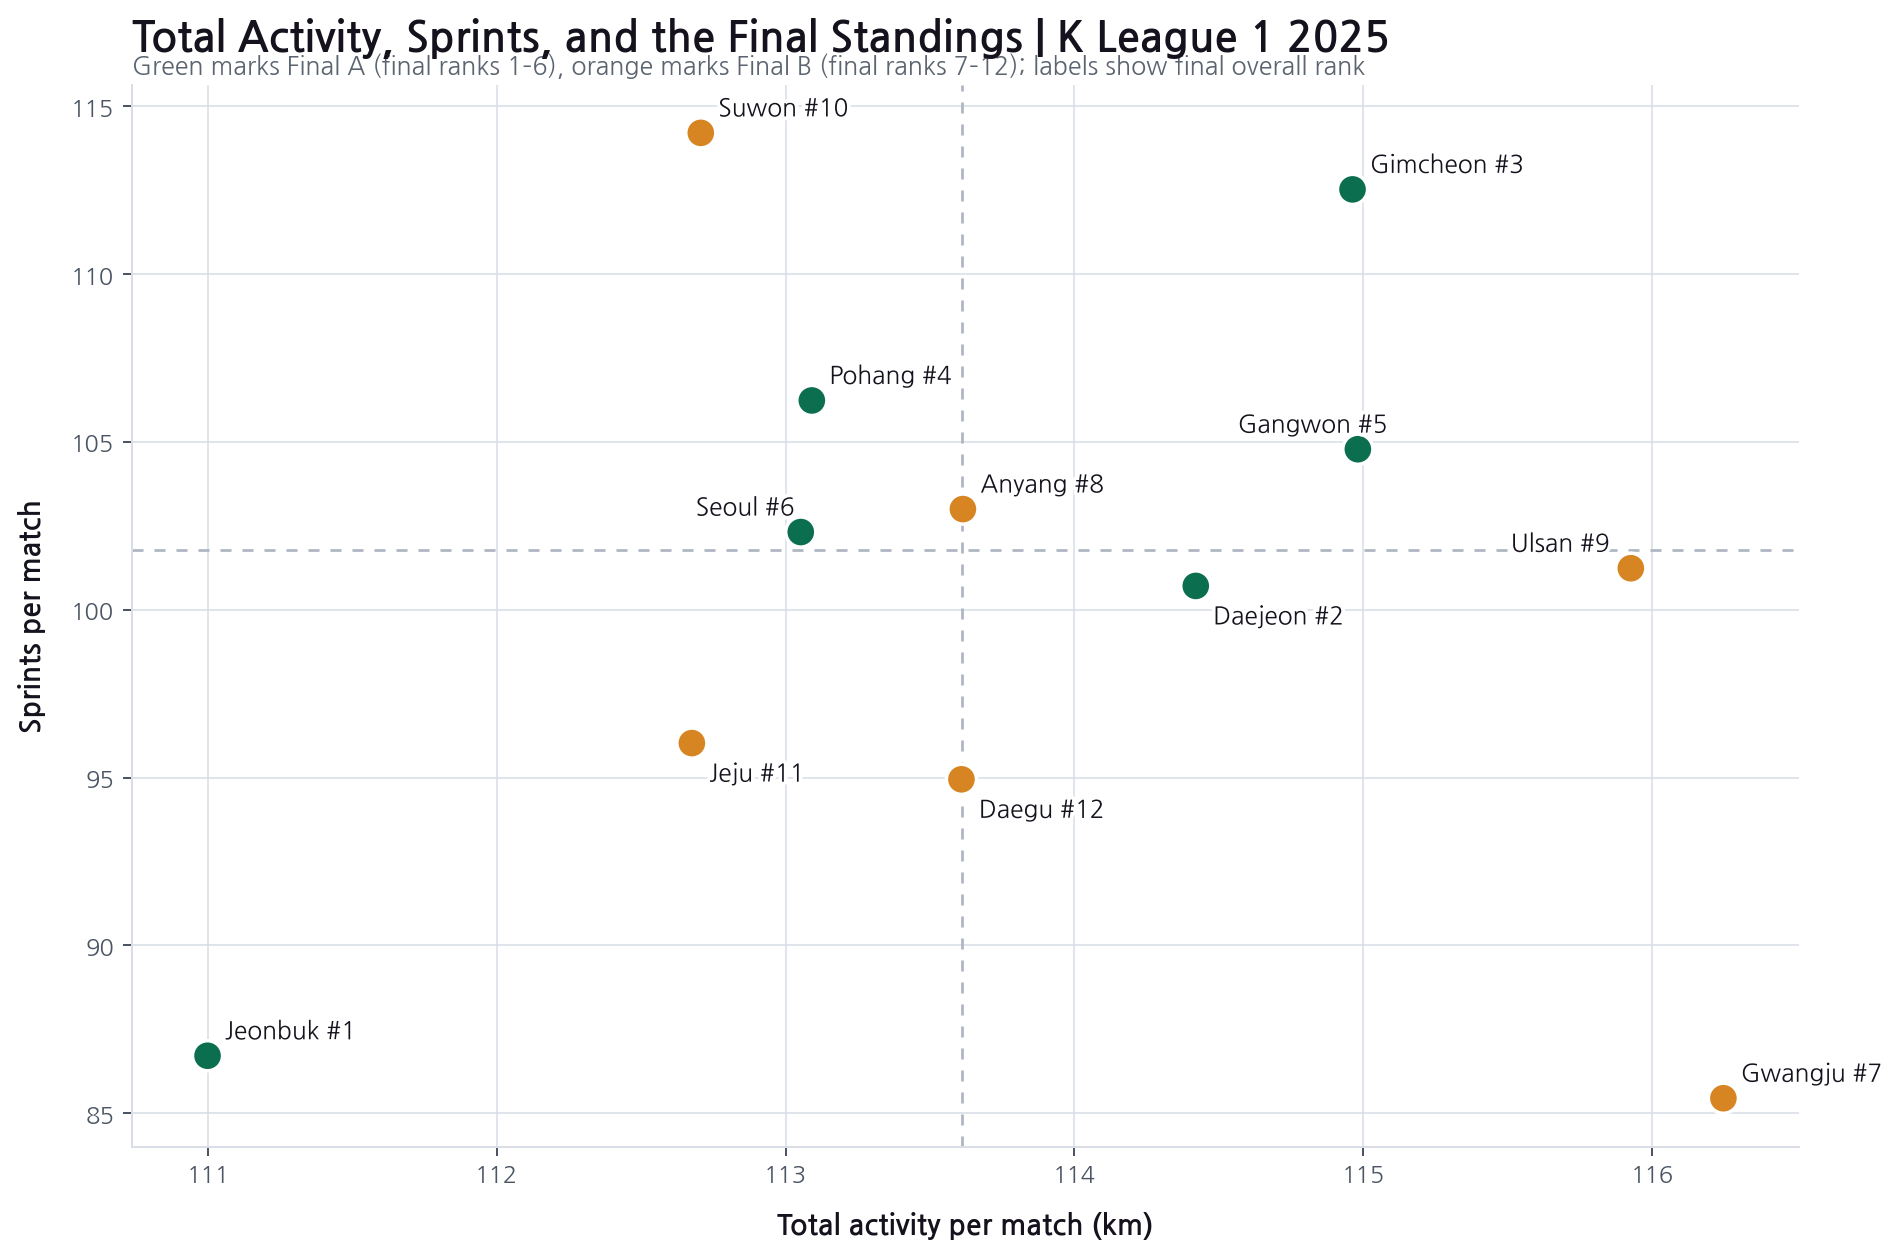
Calculating total activity per match, Gwangju covered the most ground of any team — yet finished 7th. Jeonbuk, who covered the least, won the league.
Physical data tells us precisely who ran the most. On its own, though, it can't tell us why they ran. This article traces where that gap begins, widening the question step by step from total distance to intensity, possession state, and off-ball context.
1. Speed, Acceleration, and Top Speed: Three Yardsticks
In football, a player's physical metrics include total distance, sprints, high-intensity activity, acceleration and deceleration, and top speed.
A player's speed is split into three bands, as shown below. Entering a band alone isn't enough to be recorded — a player must sustain that speed for at least 0.7 seconds for it to count as one movement (an "effort").
| Band | Speed | Description |
|---|---|---|
| Running | 15–20 km/h | Clearly faster than a brisk walk — a preparatory kind of movement |
| HSR (high-speed running) | 20–25 km/h | Genuine high-speed movement |
| Sprint | Above 25 km/h | All-out sprinting |
| High-intensity distance | HSR + Sprint | Distance combining the two bands above |
Acceleration follows the same rule. Acceleration above 3 m/s² sustained for at least 0.7 seconds counts as a high-acceleration effort. It's not a measure of how fast a player ran, but of how often they exploded into a sharp start.
PSV99 looks like a player's "top speed," but it's slightly different. Rather than the single fastest moment recorded in one match, it's the season average of each match's 99th-percentile speed, calculated across every burst of movement above 15 km/h. It captures players who repeatedly reach high speeds better than it captures a player who happened to be fast just once.
The rest of this article doesn't use these numbers as raw totals. Instead, they're normalized for actual playing time and split by whether a team was in or out of possession. The same total distance can tell a very different story depending on when, and in which phase, it was accumulated.
2. Same 90 Minutes, Different Intensity
The activity gap between Gwangju and Jeonbuk we saw earlier is based on total distance alone. Even the same total distance looks different depending on which speed bands it's built from.
Plotting sprints per match alongside total activity, and coloring by final standing, immediately shows that activity and results don't move in the same direction. Gwangju, first in activity, had the fewest sprints of any team; Jeonbuk, last in activity, won the league; and Suwon FC, near the bottom in activity, led the league in sprints yet finished the season 10th.
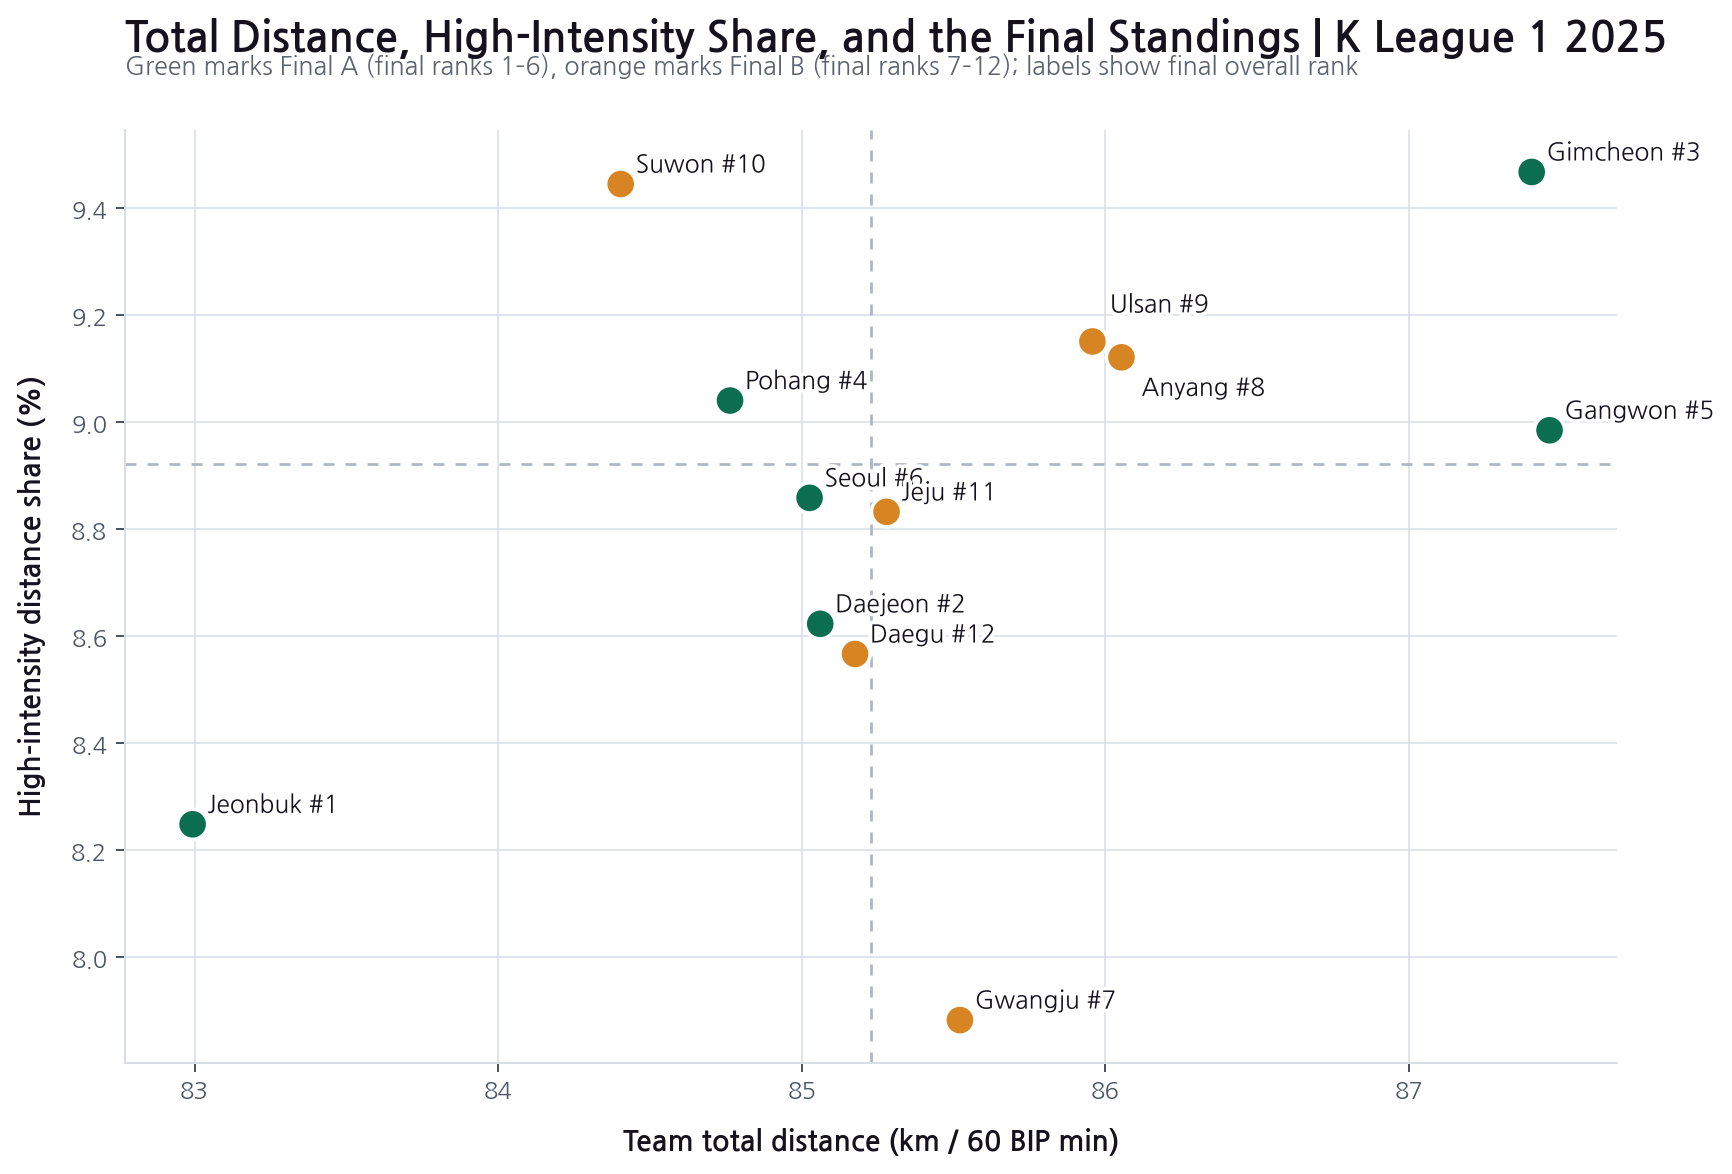
Looking at these same numbers per 60 minutes of actual ball-in-play (BIP) time, and as a share of high-intensity distance, reveals yet another picture. Because the amount of time the ball is in play differs by team, per-match figures also reflect differences in how often play is stopped. We therefore use BIP per 60 minutes to adjust for differences in actual playing time.
This time, Gangwon and Gimcheon rise to the top in total distance, while Gimcheon (9.47%) and Suwon FC (9.45%) sit almost level at the top in high-intensity share. Gwangju has the lowest high-intensity share of all 12 teams at 7.88%, and Jeonbuk has the lowest total distance. Overlaying the two charts, Gimcheon is the only team that stayed near the top across all four measures — activity, sprints, BIP-adjusted total distance, and high-intensity share — while Jeonbuk sat near the bottom on all four and still won the league.
Even when the totals for activity and intensity are similar, whether that intensity is spent while in possession or out of possession can differ.
TIP (Team In Possession) is the time a team spends with the ball; OTIP (Out of Team In Possession) is the time the opponent has it. Splitting high-intensity distance across these two states and normalizing each to 30 minutes shows where each team produced more high-intensity movement — while in possession or while out of it.
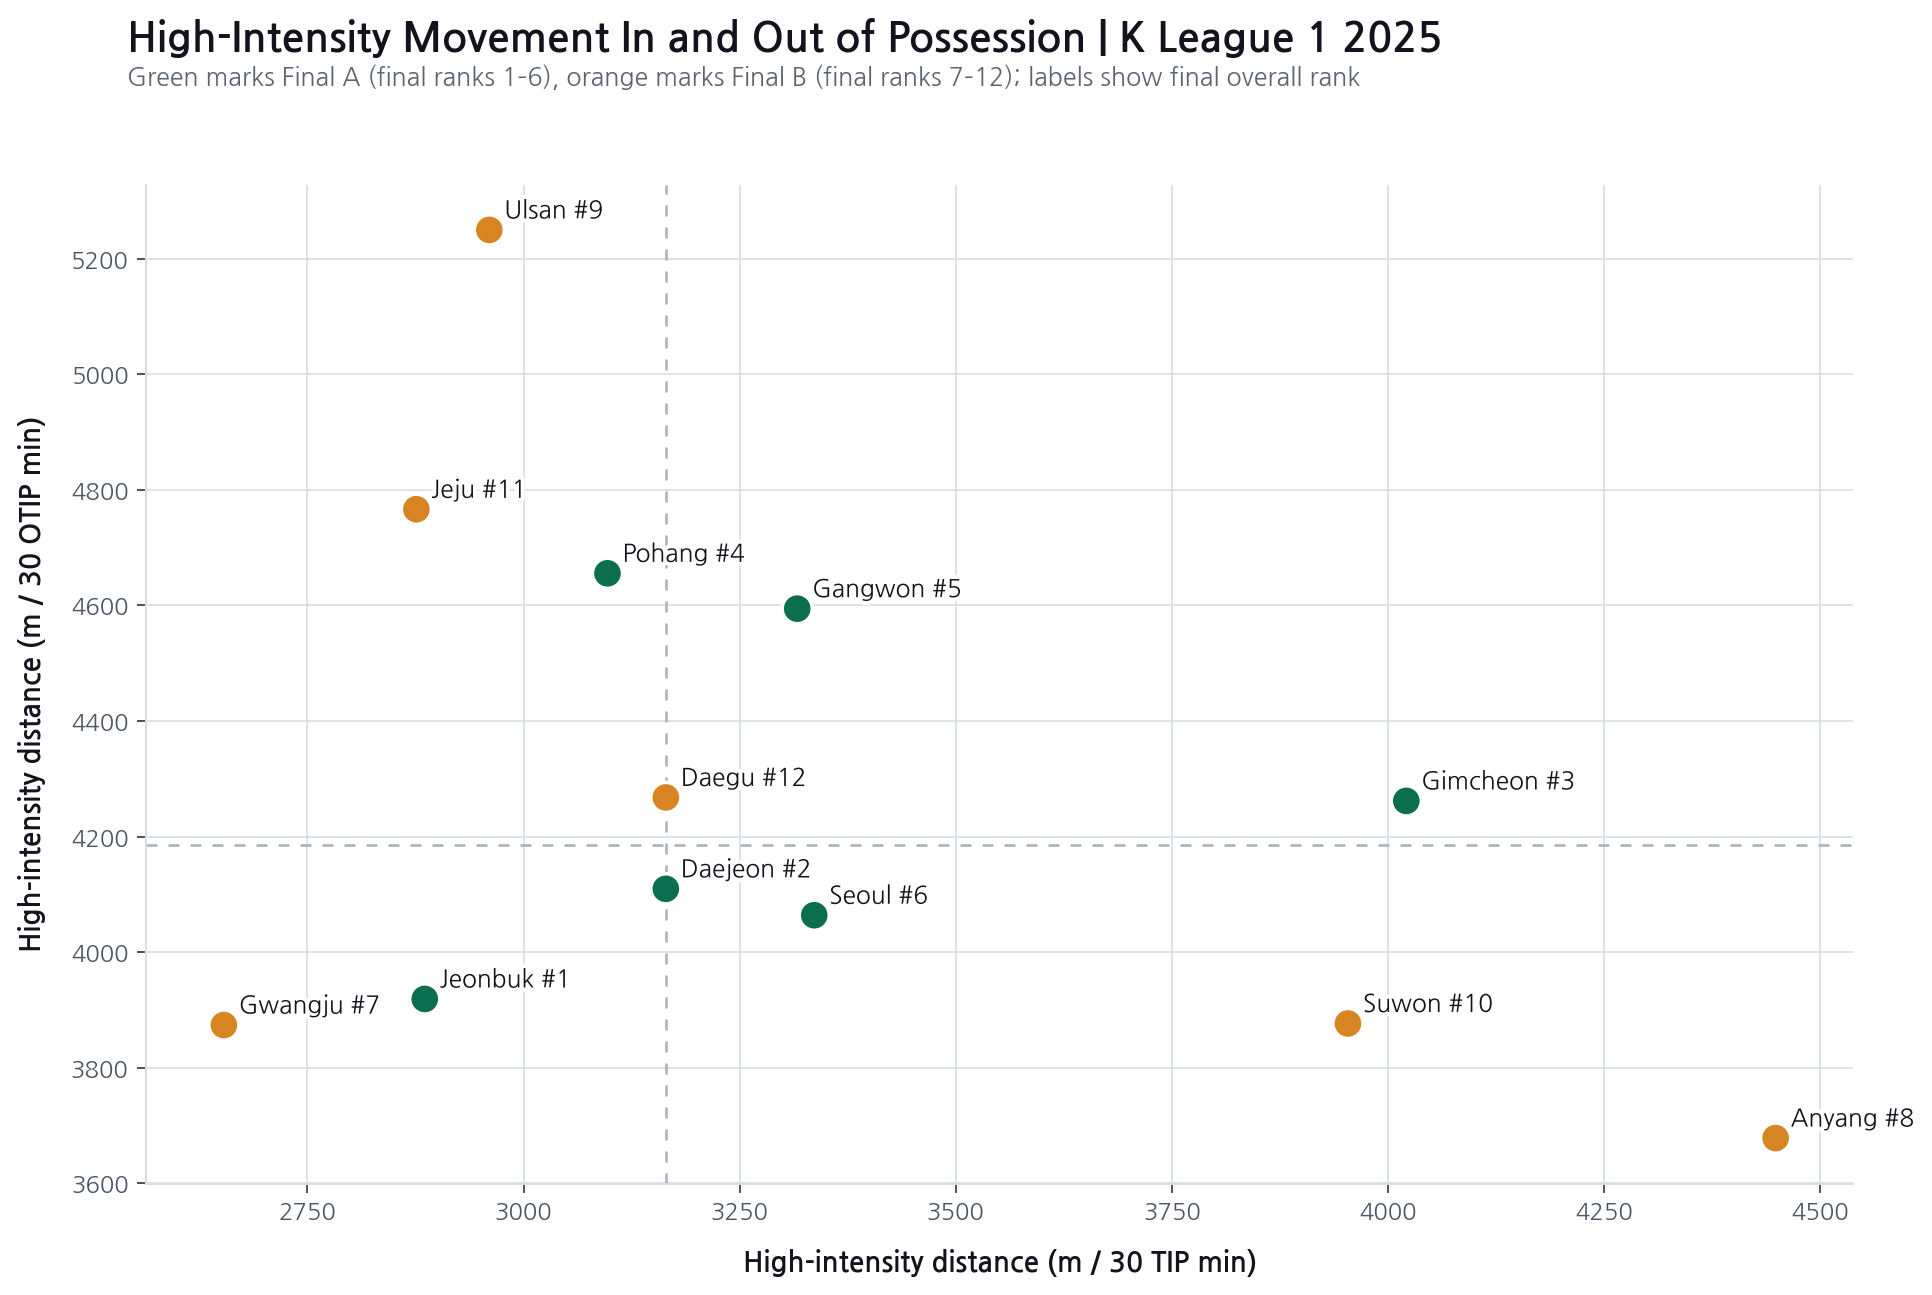
Anyang's in-possession (TIP) high-intensity distance was the highest in the league at 4,448 m per 30 TIP minutes, but their out-of-possession (OTIP) figure was the lowest at 3,680 m. Ulsan was the exact opposite — highest out of possession at 5,250 m, but near the bottom in possession at 2,960 m. Both teams concentrate their intensity almost entirely in one state.
Gimcheon and Gangwon stayed in the upper-middle range on both sides. Jeonbuk, Daejeon, and Seoul, by contrast, sat in the lower-middle range on both.
These numbers can't be linked directly to results, but they do show a clear signature of which state — in possession or out of it — each team leaned on for high-intensity movement.
Next, we can look at exactly which situations produced that high-intensity movement for each team.
Off-ball runs are classified into the following phases.
| Phase | Meaning |
|---|---|
| Build-up | Play in a team's own half, with the ball carrier under pressure or the opponent set up high |
| Chance Creation | Standard attacking build-up carried out through central areas |
| Finishing | The finishing stage near the opponent's back line, once possession has been established for at least one second |
| Transition | Advancing quickly after regaining the ball in a team's own half |
| Quick Break | Advancing quickly after regaining the ball in the opponent's half |
| Direct Play | Play that starts with a long ball of 32 m or more from a team's own half and continues through to the reception |
| Disorganized | Short, contested possession (fewer than three passes, etc.) |
| Set Piece | Corners, free kicks, long throw-ins, and similar |
Breaking this composition down by team gives the following picture.
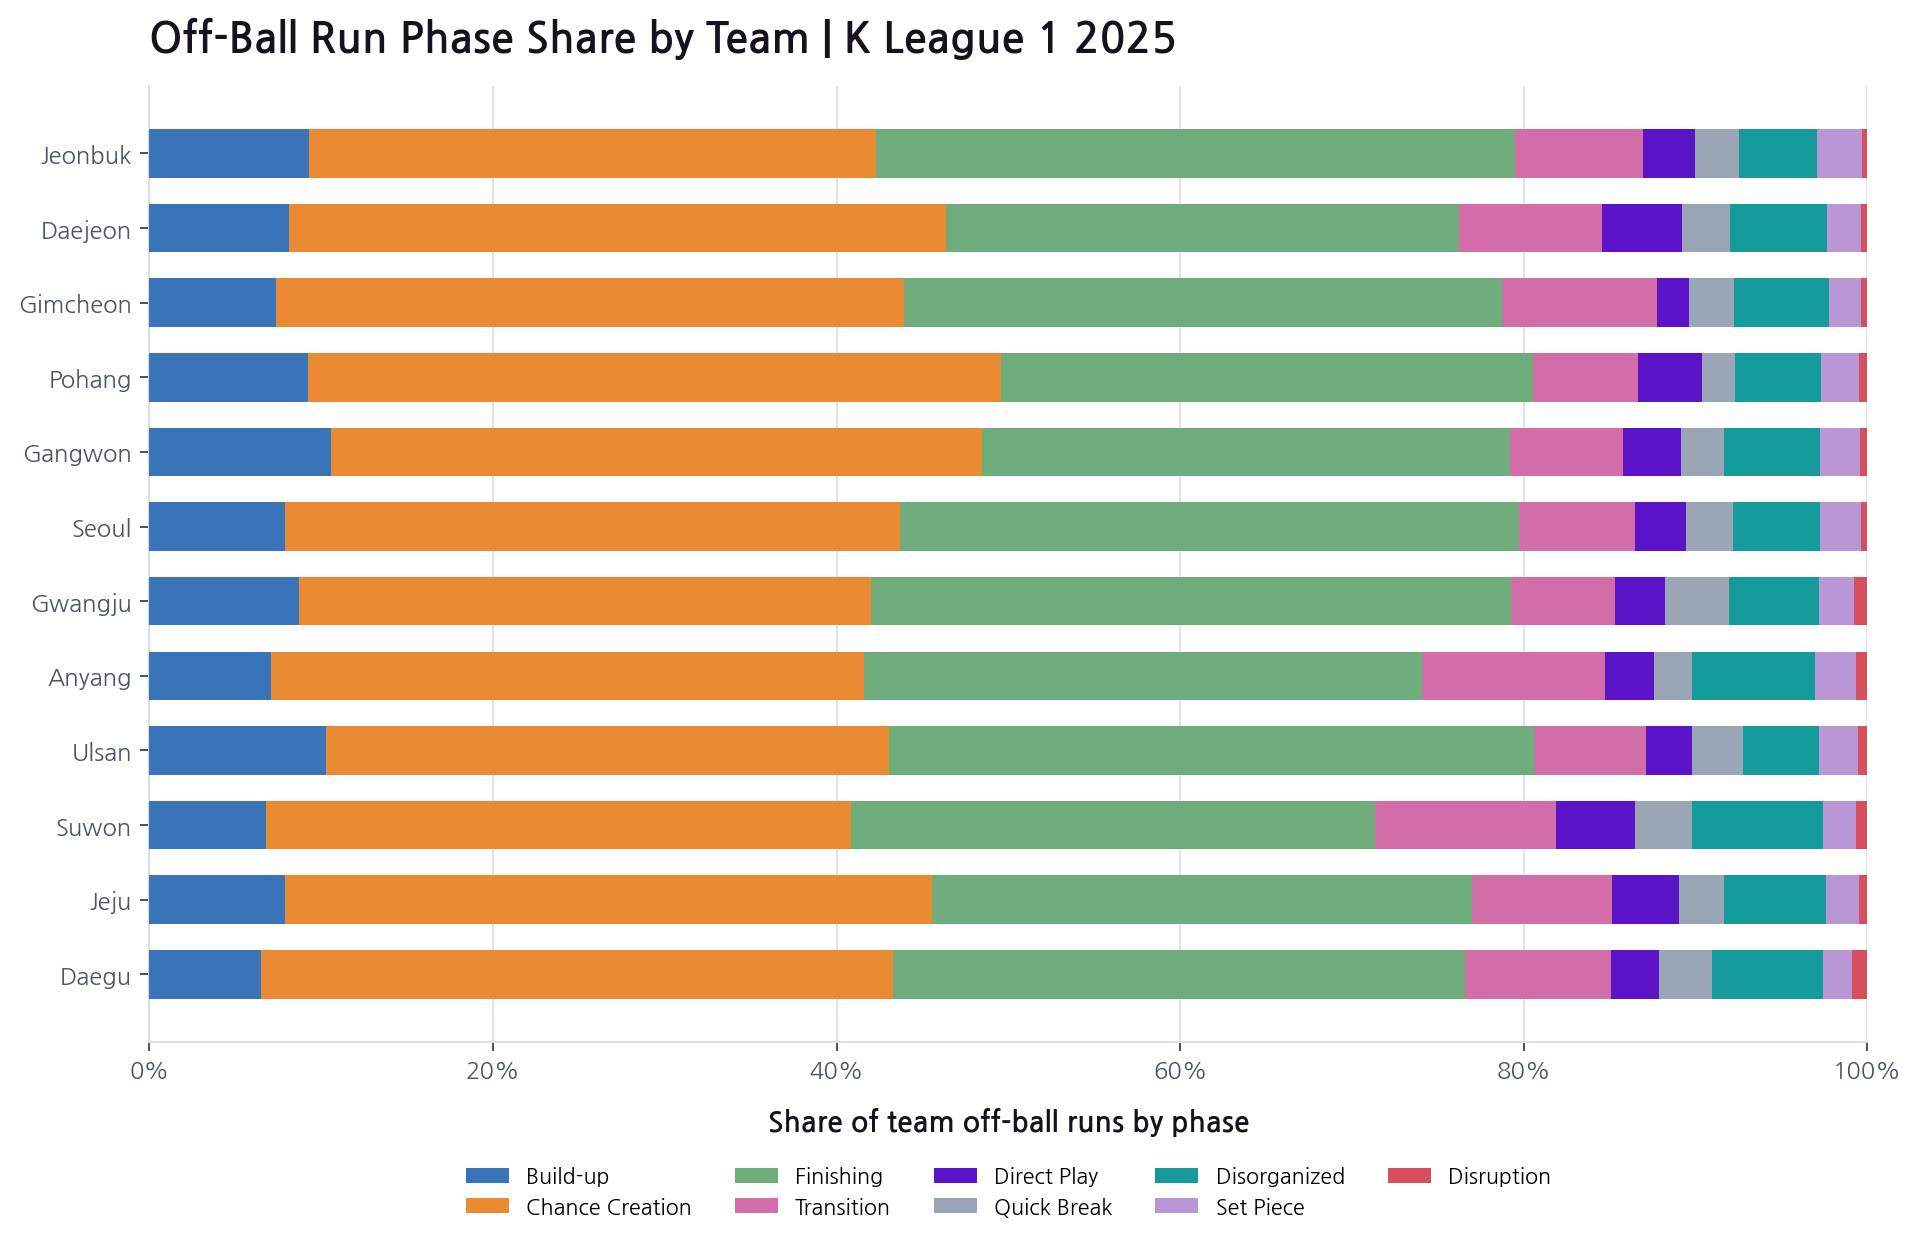
Suwon FC's Transition phase — advancing after regaining the ball in their own half — made up 10.5%, Direct Play 4.6%, and Quick Break — advancing after regaining it in the opponent's half — 3.3%, for a combined 18.4% across the three. Anyang's Transition share was the highest in the league at 10.6%. Both teams are relatively concentrated in Transition and Direct Play.
Other teams leaned the opposite way, toward building and finishing possessions. Pohang's Chance Creation share was the highest in the league at 40.3%, Gangwon's Build-up share peaked at 10.6%, and Ulsan's Finishing share was the highest at 37.6%.
Gimcheon, compared with the other teams, wasn't skewed toward either side.
These results show which phase each team relied on most to generate off-ball runs.
3. Seungbeom Ko Runs Far, Junha Kim Runs Often
So far we've looked at activity, intensity, and possession states at the team level. Now let's take the same questions down to the level of individual players.
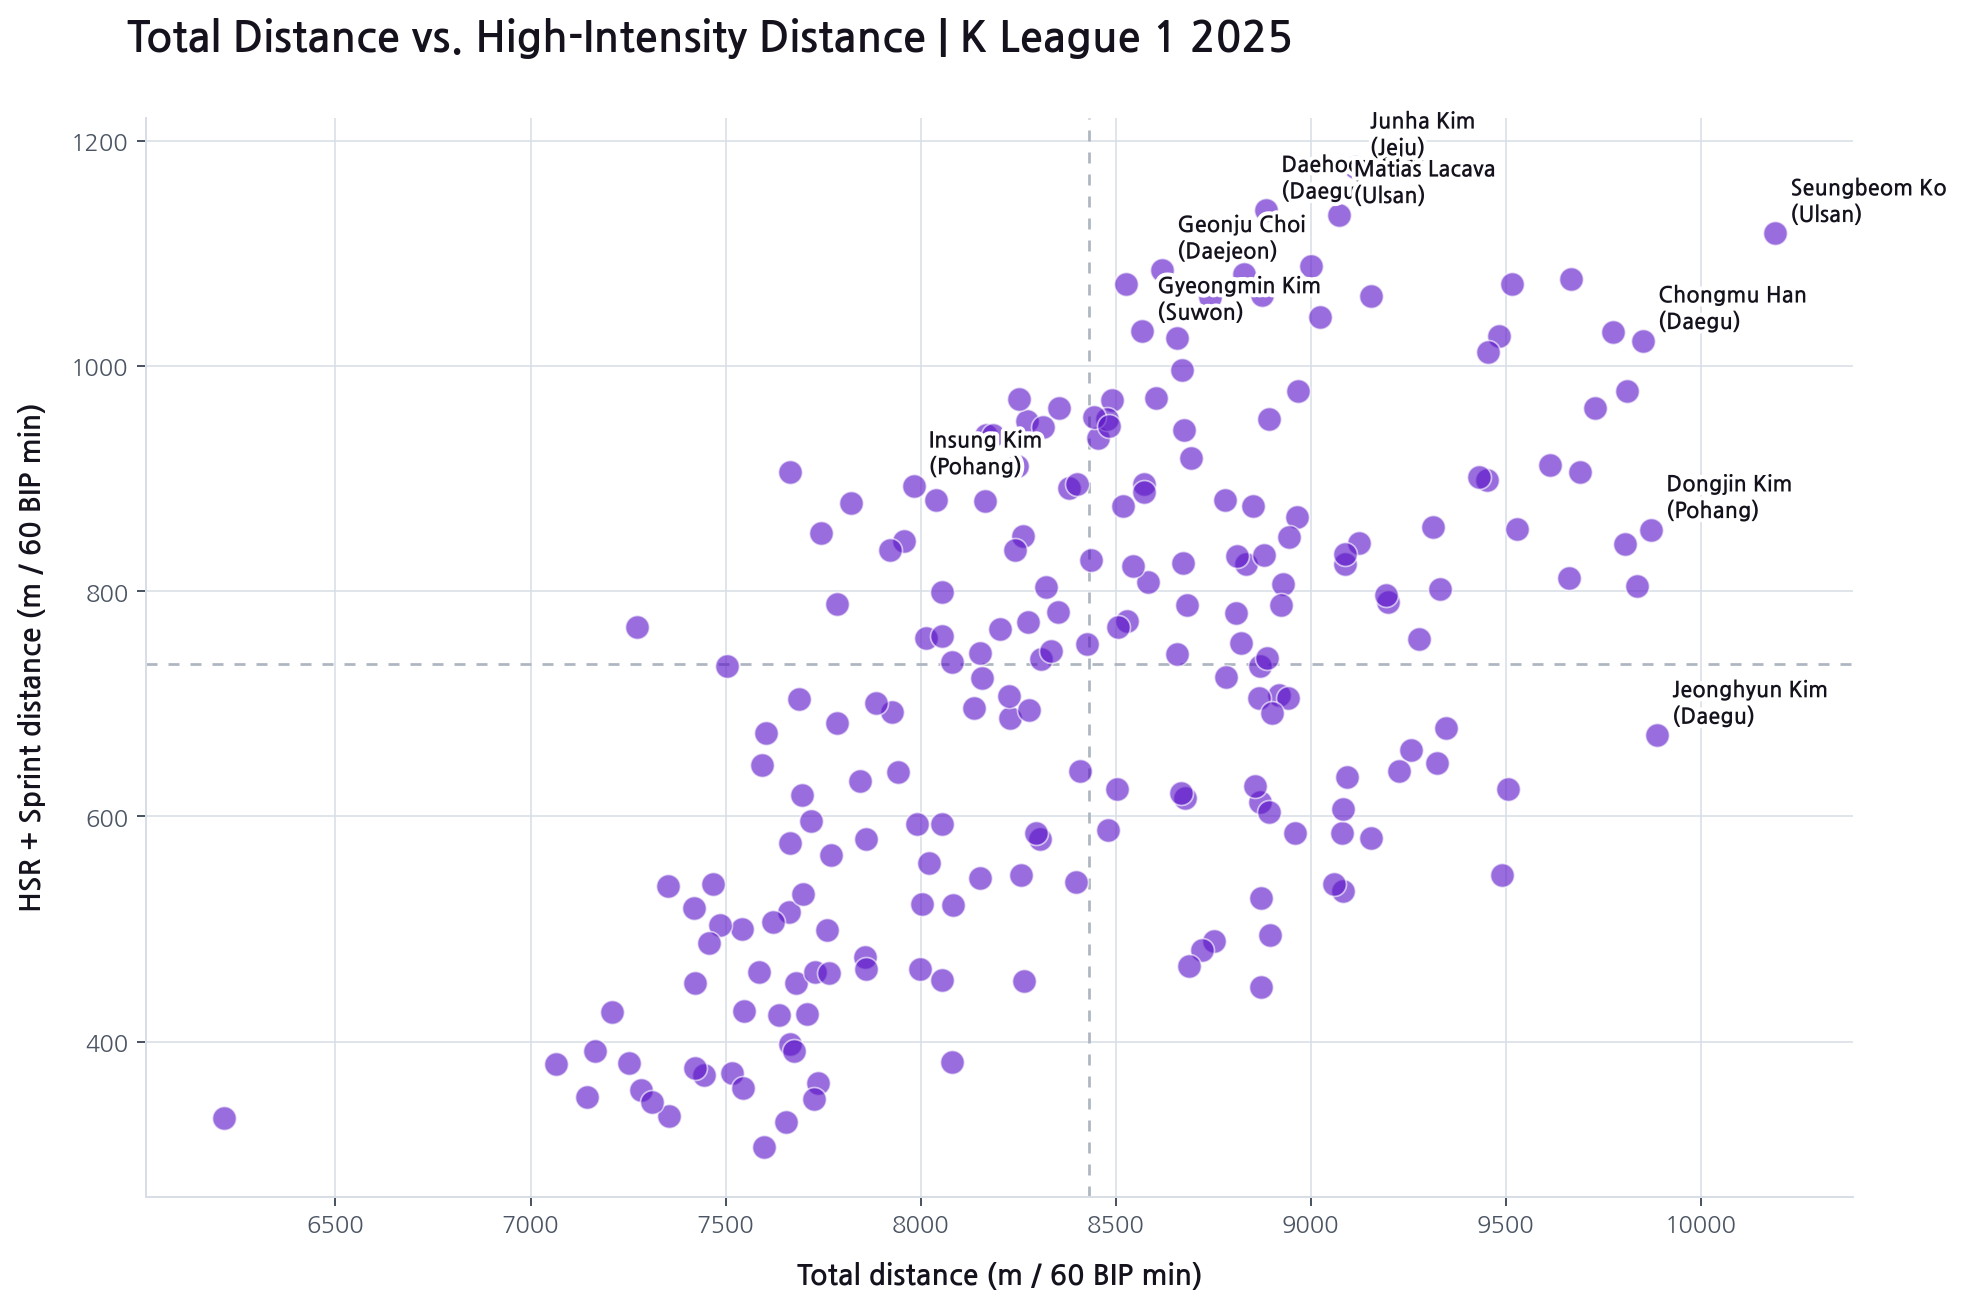
By total distance per 60 BIP minutes, Ulsan's Seungbeom Ko leads the league at 10,191.9 m. He's also first in HSR distance at 929.6 m, making him a case where high overall volume and high-speed running go hand in hand.
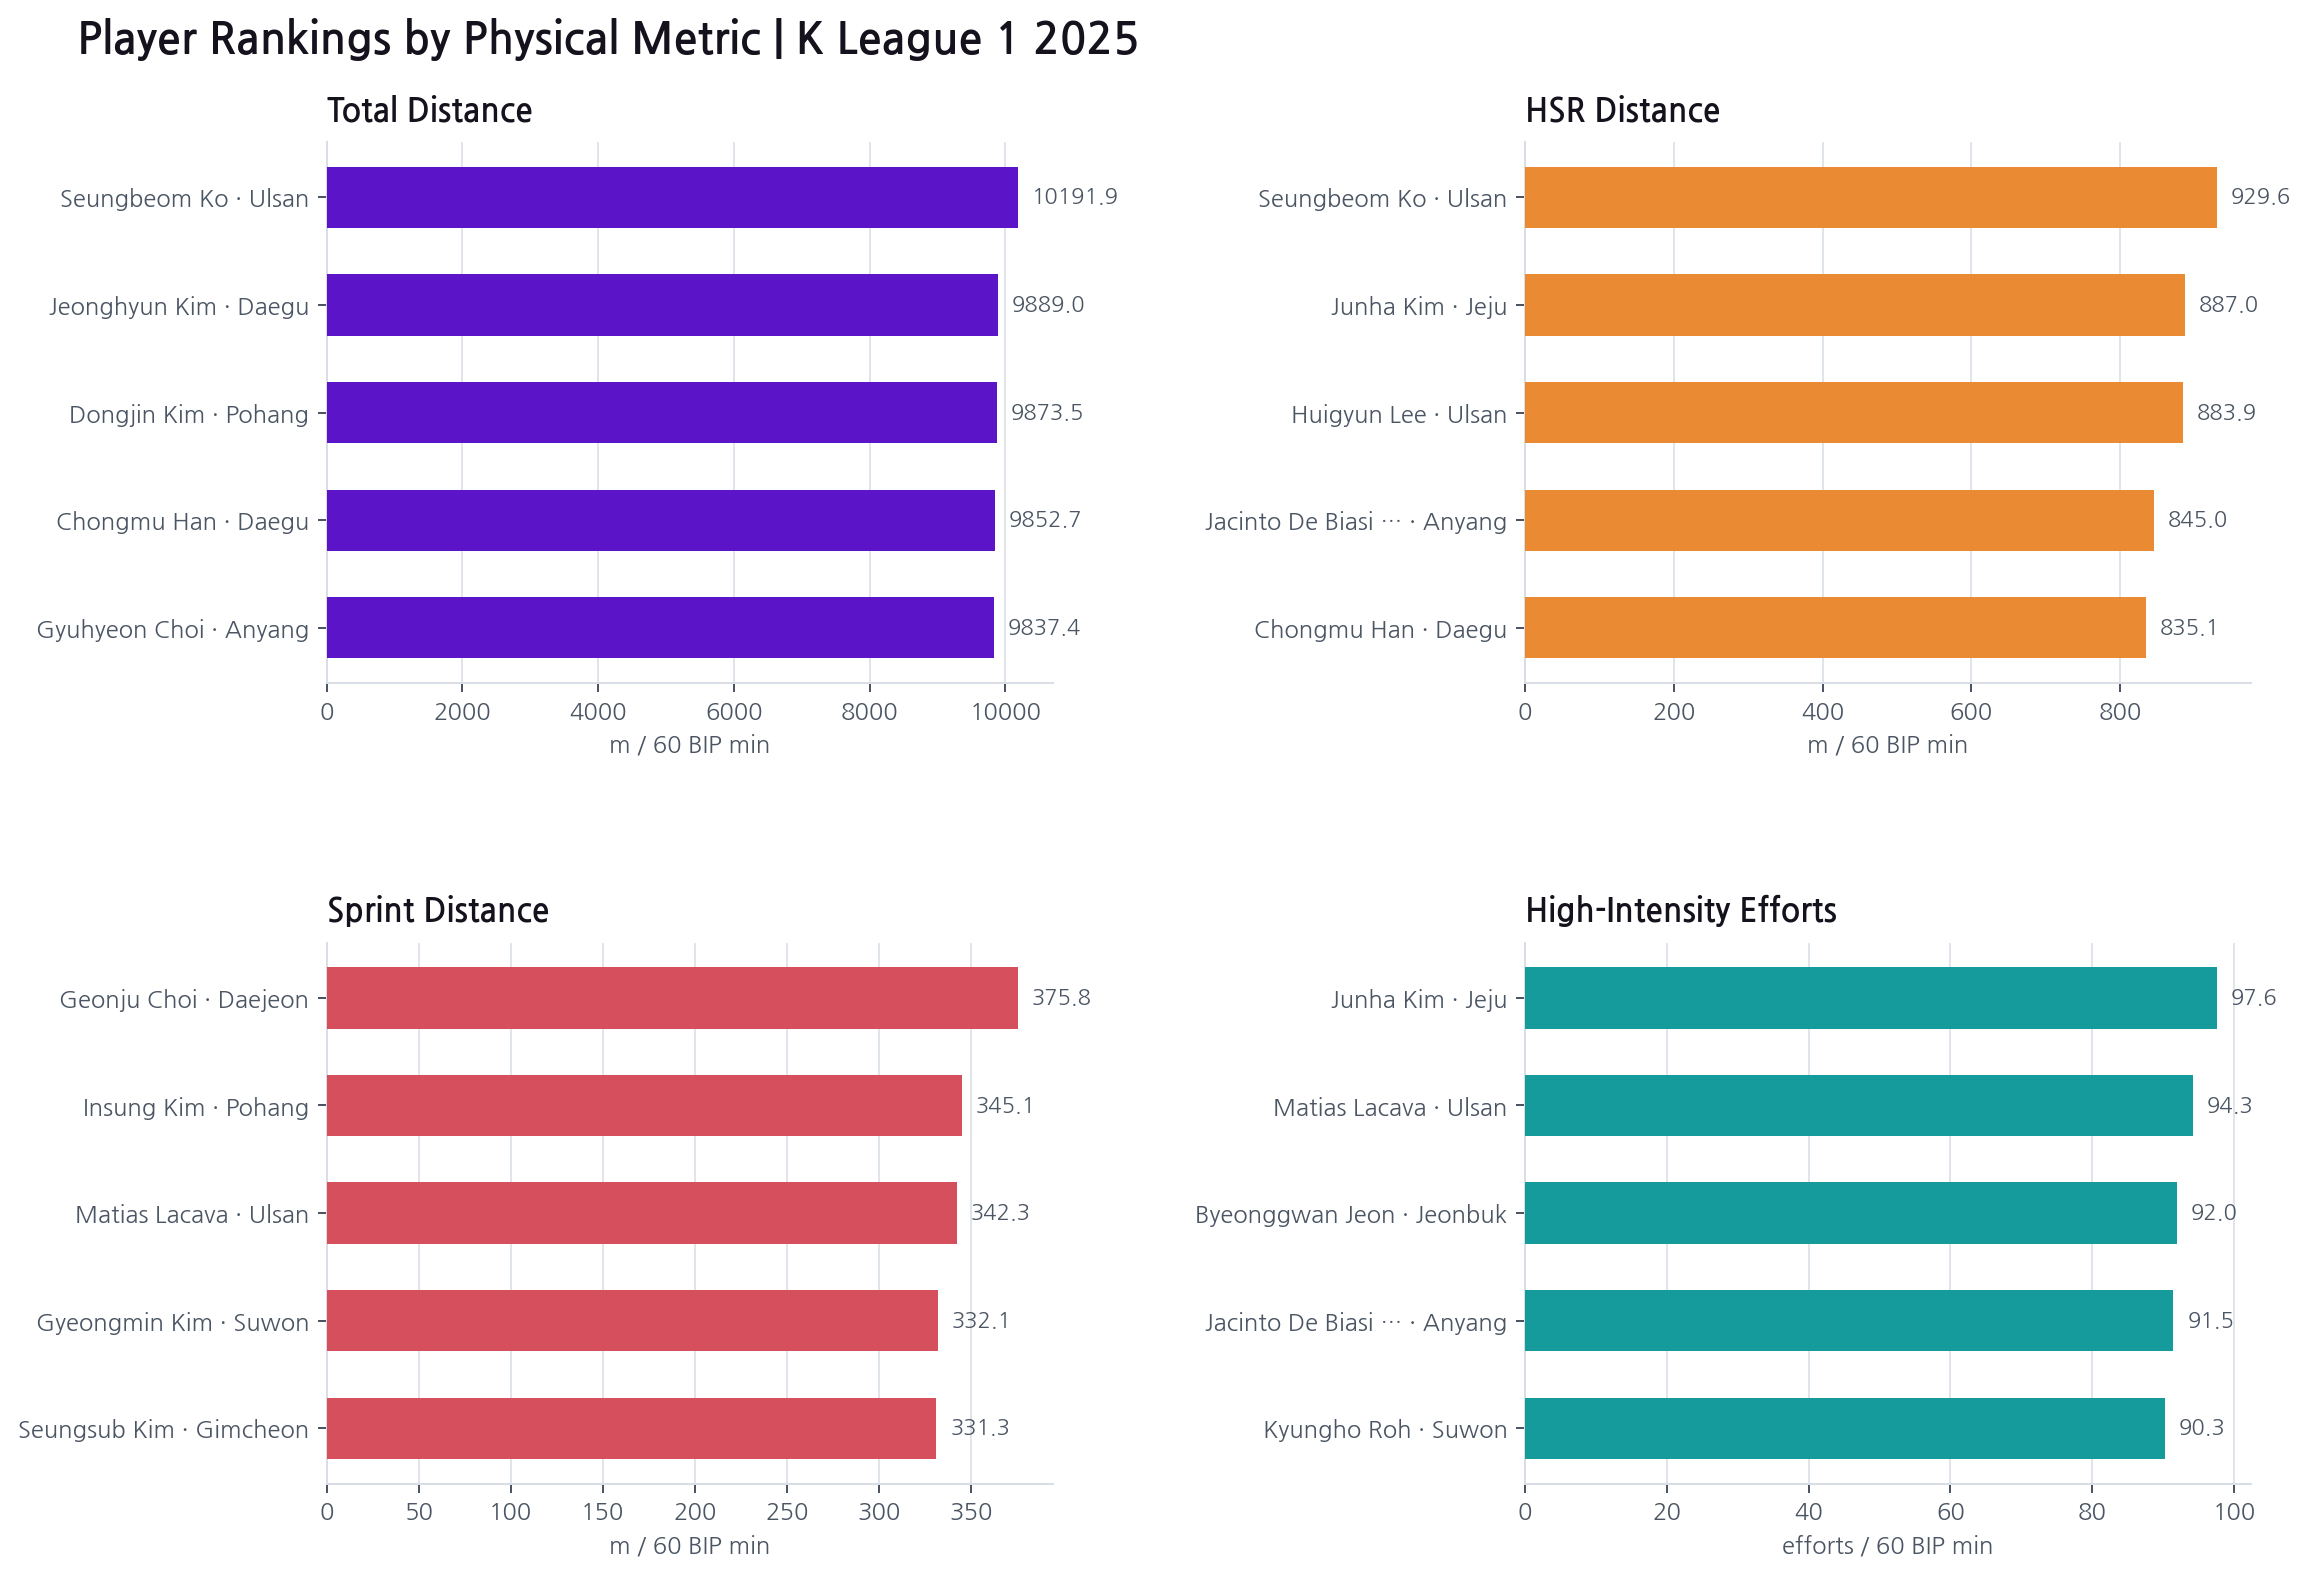
But HSR distance and high-intensity effort count ask different questions. HSR distance measures how far a player covered at that speed; count measures how often they entered that speed band at all. By this measure, Jeju's Junha Kim leads at 97.6 efforts. Daejeon's Geonju Choi leads sprint distance at 375.8 m. A player like Ko, who covers long distances in single bursts, a player like Kim, who repeatedly enters high-speed bands in short bursts, and a player like Choi, who accumulates more sprint distance, represent different physical profiles.
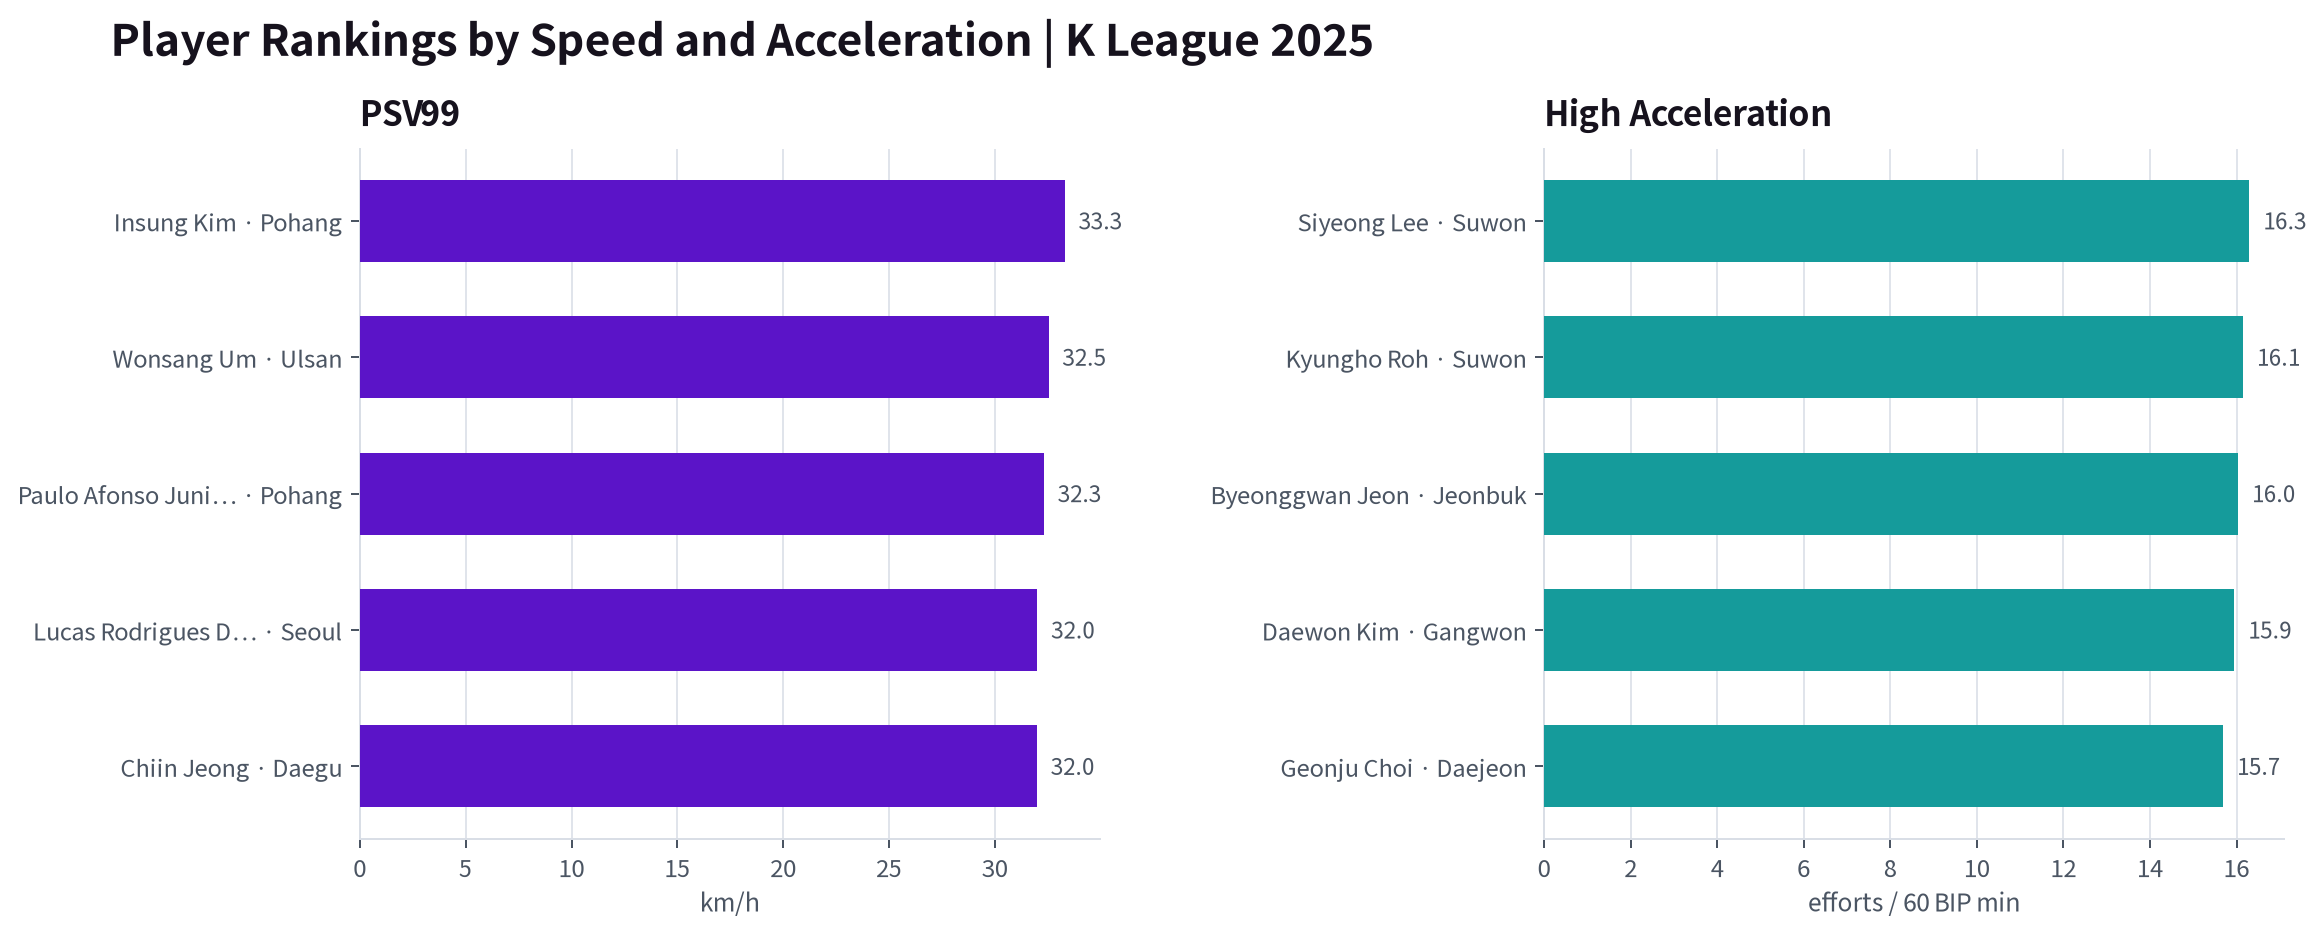
In PSV99, Pohang's Insung Kim topped the league at 33.3 km/h, followed by Ulsan's Wonsang Um (32.5 km/h) and Pohang's Paulo Afonso Junior (32.3 km/h). A high PSV99 doesn't mean more sprint distance or more sprints — it means a higher ceiling on the speed a player actually reaches.
In high acceleration (above 3 m/s² for at least 0.7 seconds), Suwon FC's Siyeong Lee led with 16.3 efforts per 60 minutes, followed by teammate Kyungho Roh at 16.1.
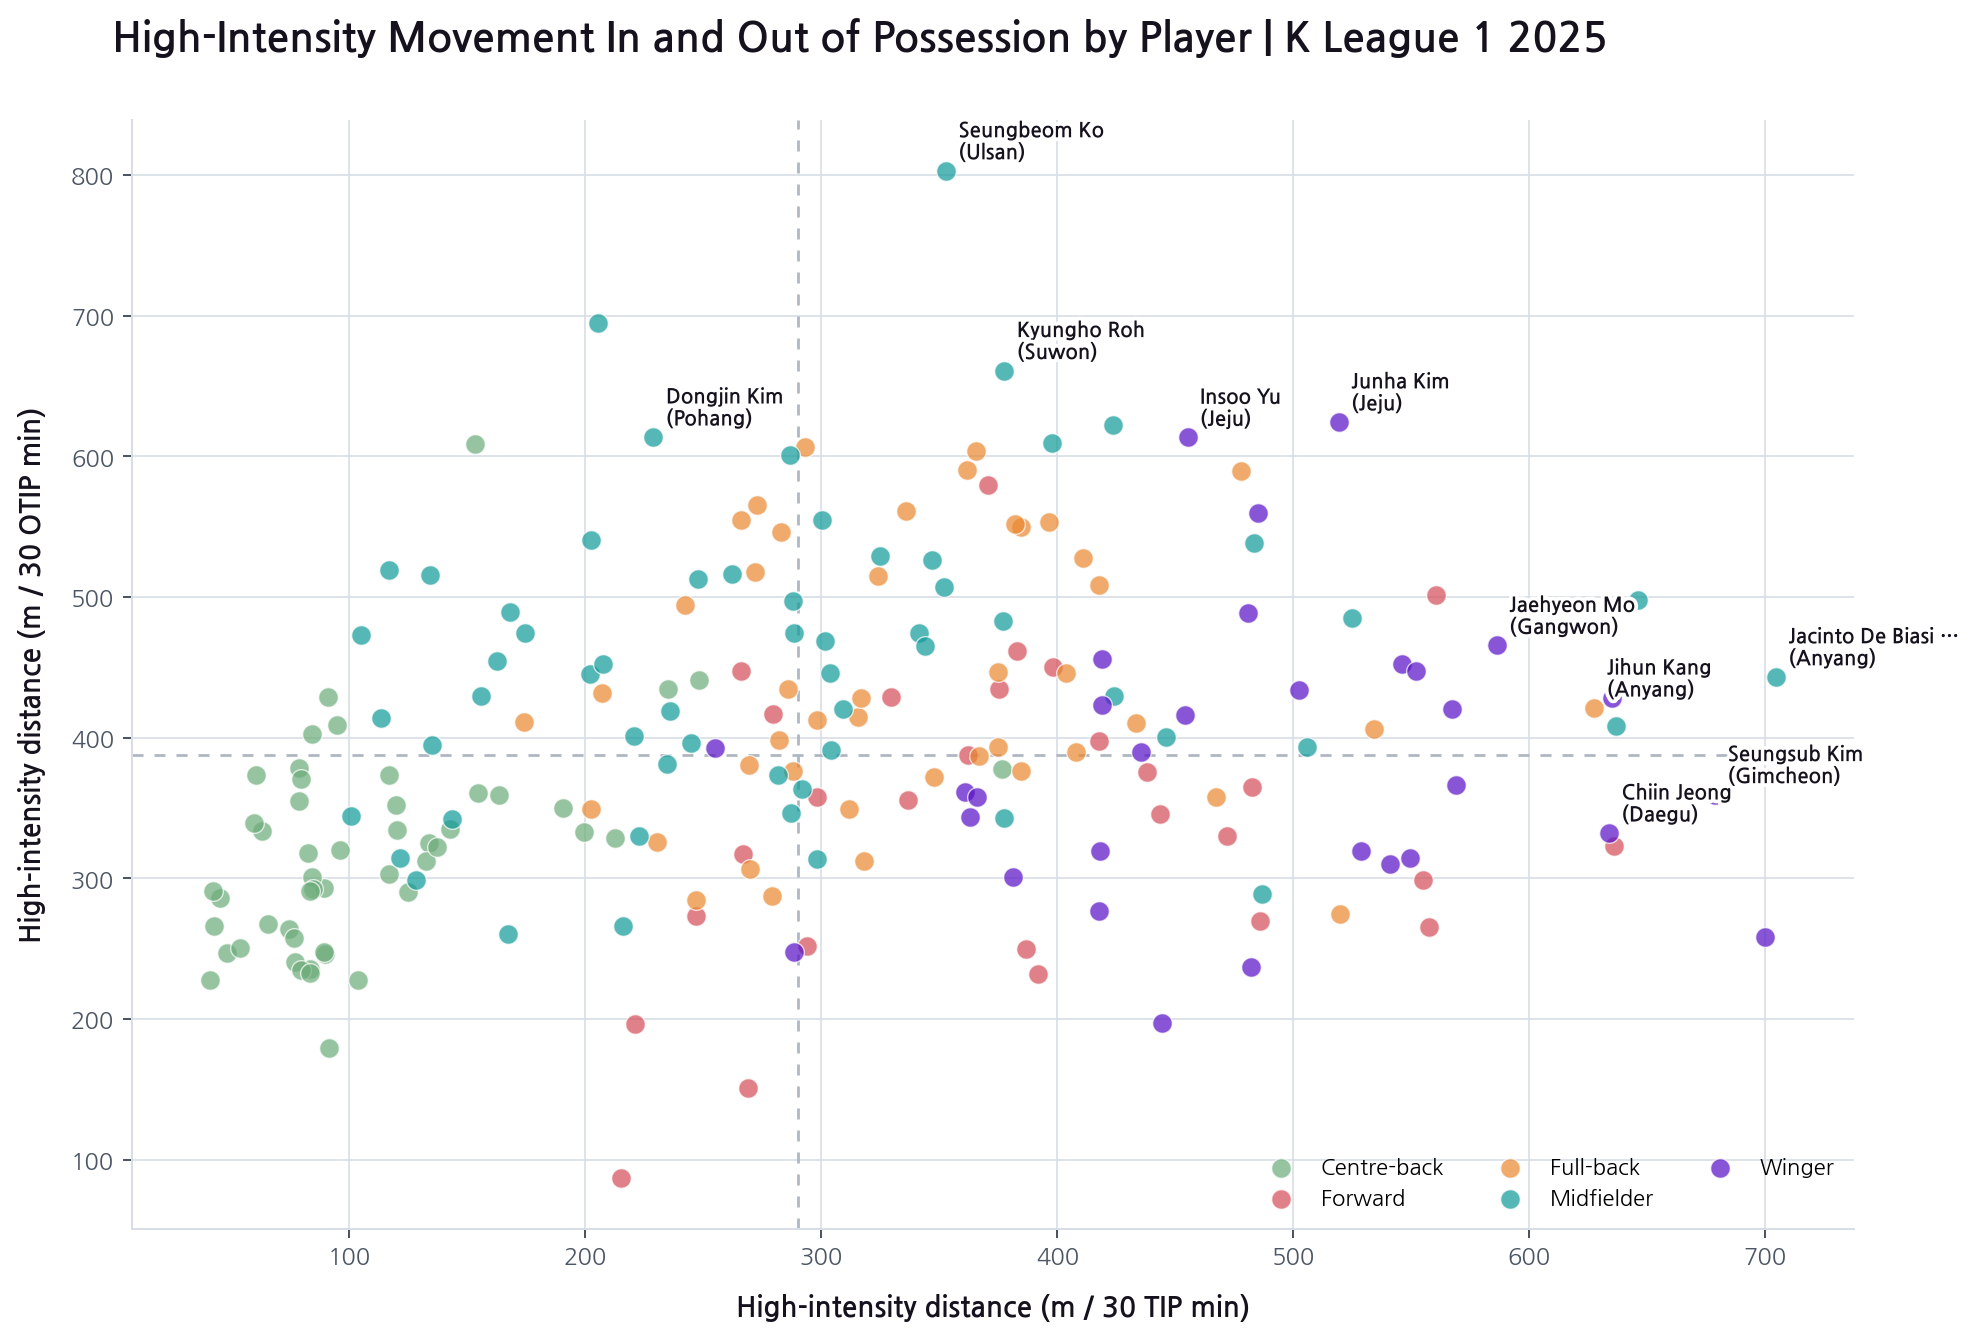
Splitting high-intensity distance in and out of possession by position shows that even the same intensity is spent at different times depending on role. Centre-backs, midfielders, and full-backs skew toward more high-intensity movement out of possession (OTIP) — for centre-backs, out-of-possession high-intensity distance runs roughly three times higher than in possession. Wingers are the one exception, running the other way: their in-possession (TIP) high-intensity distance averages 484.9 m, more than their out-of-possession figure of 384.4 m.
On top of this, let's also look at how quickly a player reaches a target speed after accelerating or changing direction.
We flag windows where acceleration exceeds 3 m/s² for at least 0.7 seconds as candidates, then measure the time until the player reaches HSR (20 km/h) or Sprint (25 km/h). Change-of-direction candidates are identified the same way: windows where the direction of movement changes by at least 60 degrees across the half-second before and after, with time to target speed measured from there.
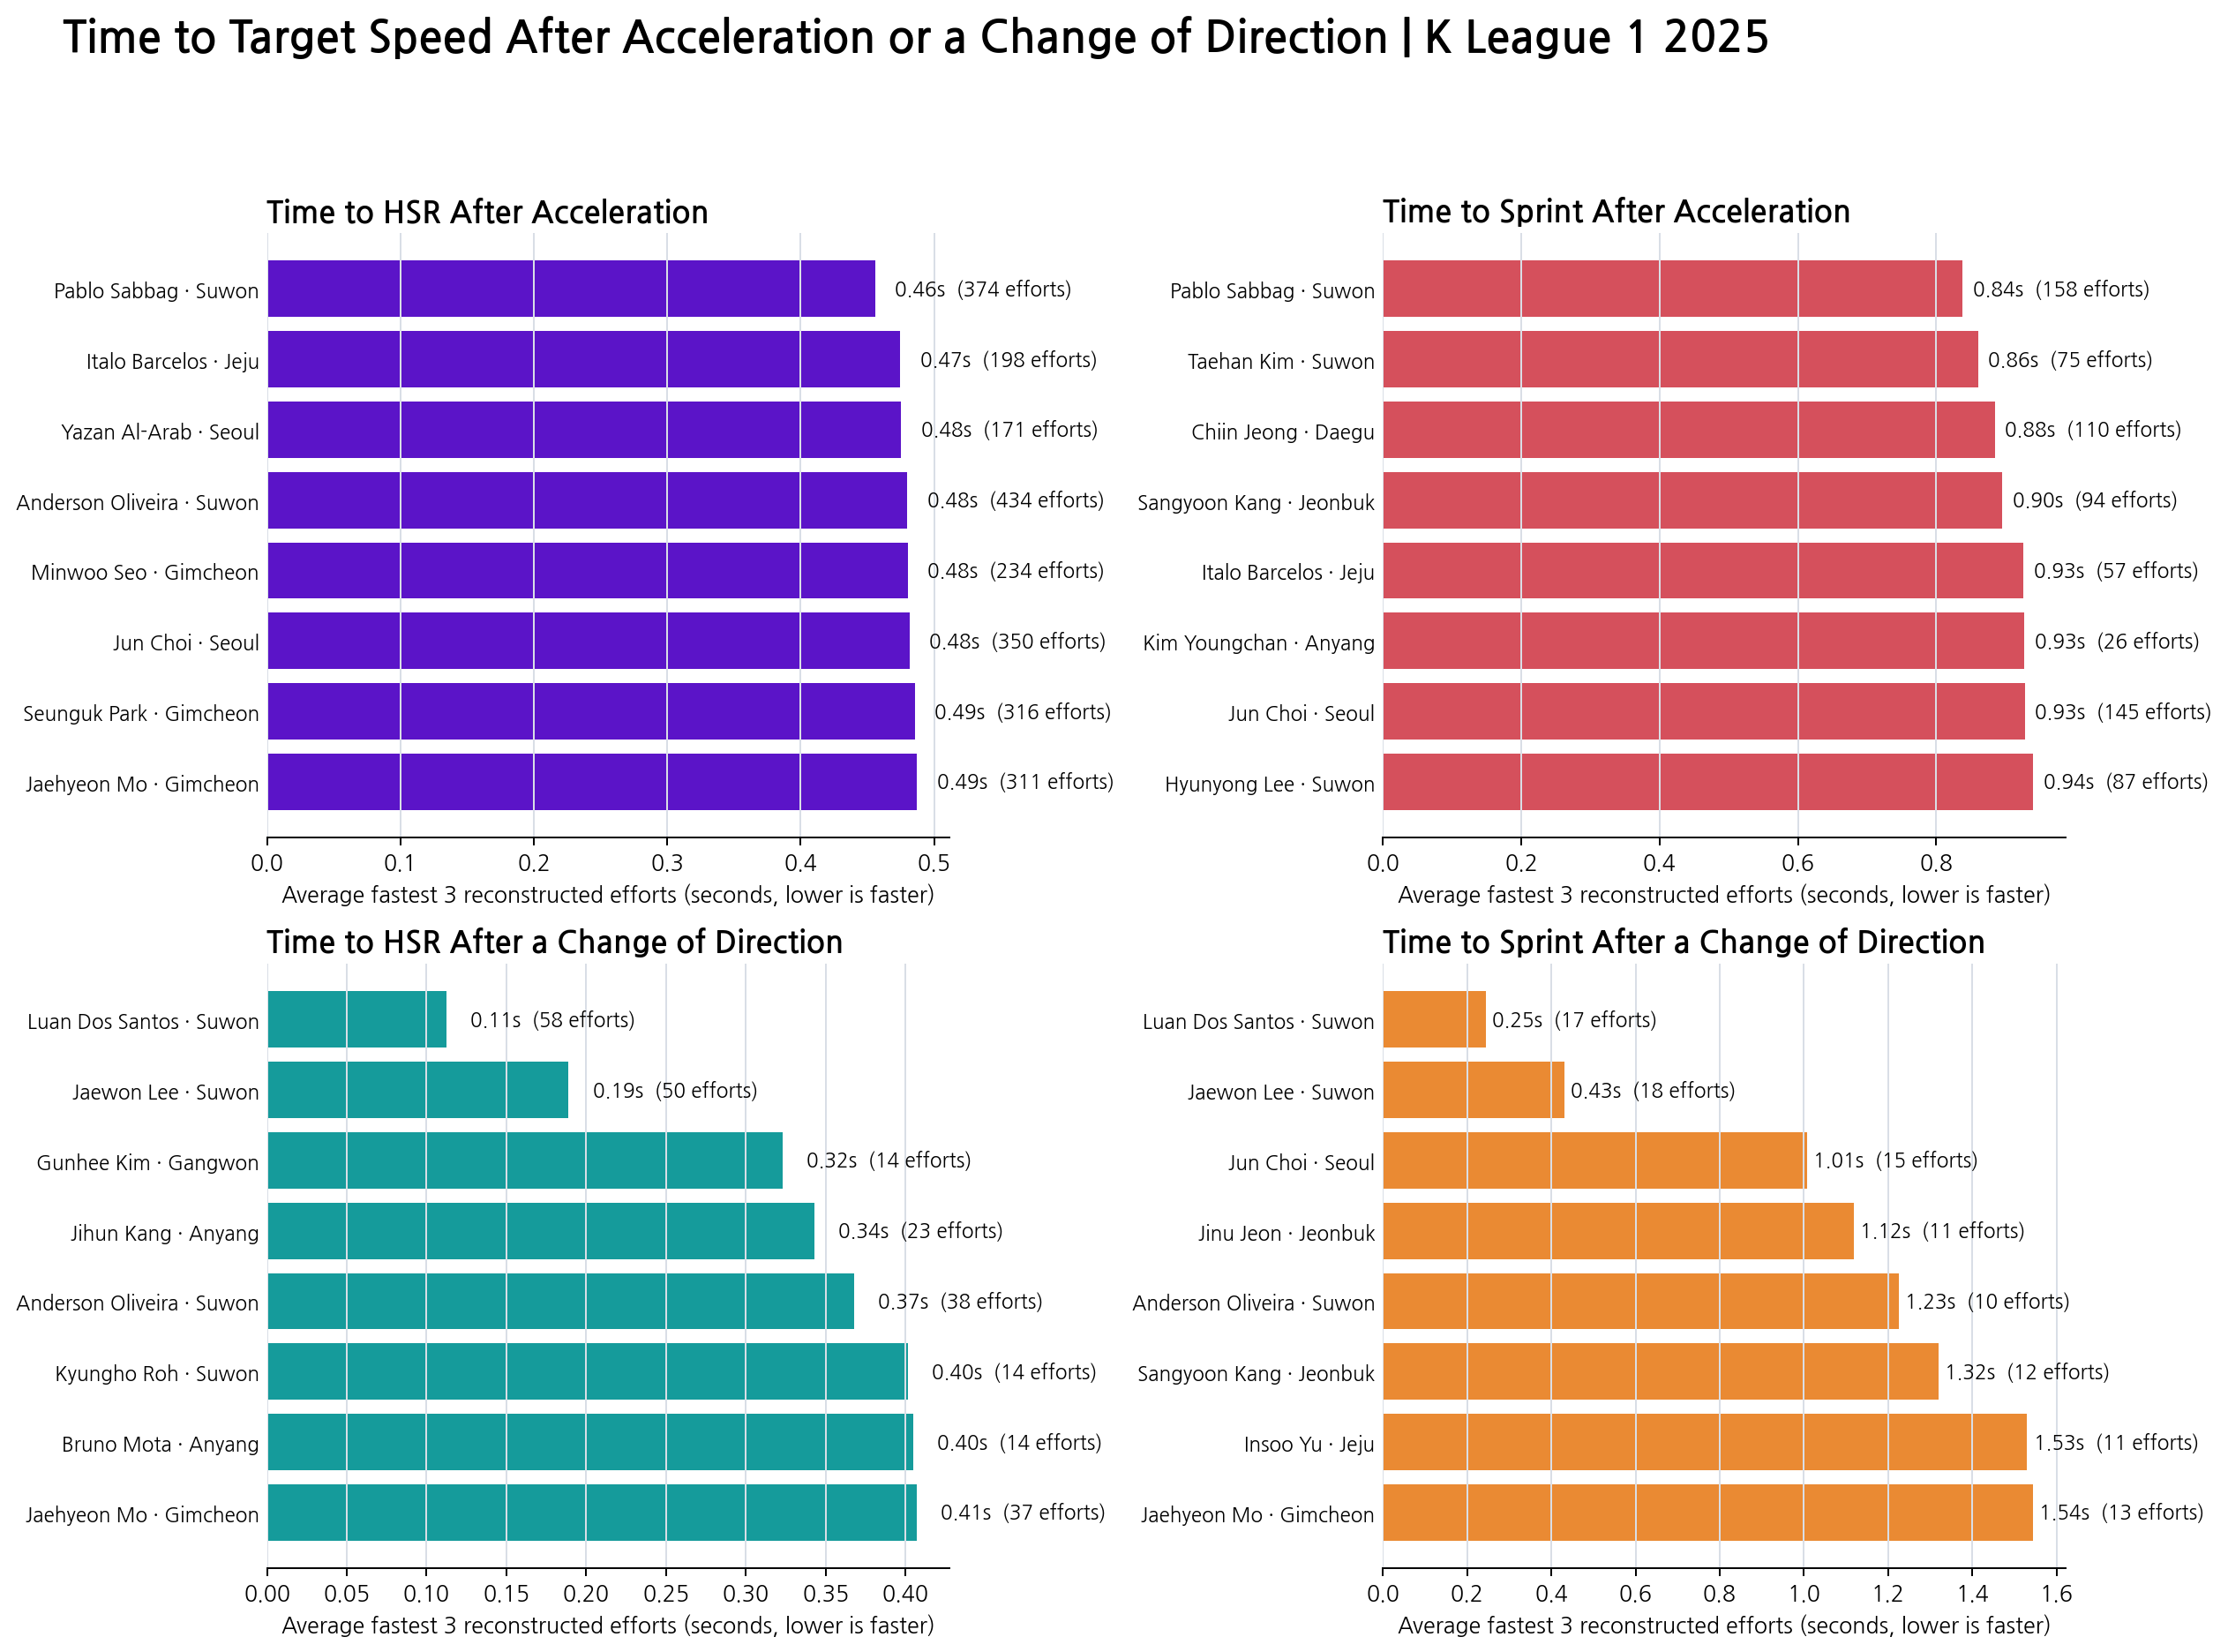
In time to HSR after acceleration, Suwon FC's Pablo Sabbag was fastest at 0.46 seconds, followed by Jeju's Italo Barcelos (0.47s) and Seoul's Yazan Al-Arab (0.48s). Sabbag also topped time to Sprint at 0.84 seconds, ahead of Suwon FC's Taehan Kim (0.86s) and Daegu's Chiin Jeong (0.88s). Sabbag sits at the very top on both measures after acceleration.
After a change of direction, an entirely different set of names appears. Suwon FC's Luan Dos Santos led both measures — 0.11 seconds to HSR and 0.25 seconds to Sprint — with teammate Jaewon Lee close behind at 0.19s and 0.43s respectively.
A range of positions shows up across these rankings. Seoul's centre-back Yazan Al-Arab and Suwon FC's centre-back Taehan Kim rank near the top after acceleration, while midfielders Luan and Lee stand alone after a change of direction. Explosiveness, too, doesn't reduce to a single position.
4. Winger Profiles Through Physical Metrics
Let's use the methods built up so far to take a look at the styles of some of the K League's leading wingers.
Among wingers who played at least 10 matches this season, we grouped volume metrics (total distance, distance per TIP and OTIP minute, running distance) and high-intensity metrics (high-intensity distance and count, sprint distance and count, PSV99) into two percentile-based indices. Based on these indices, here are the profiles of six selected wingers.
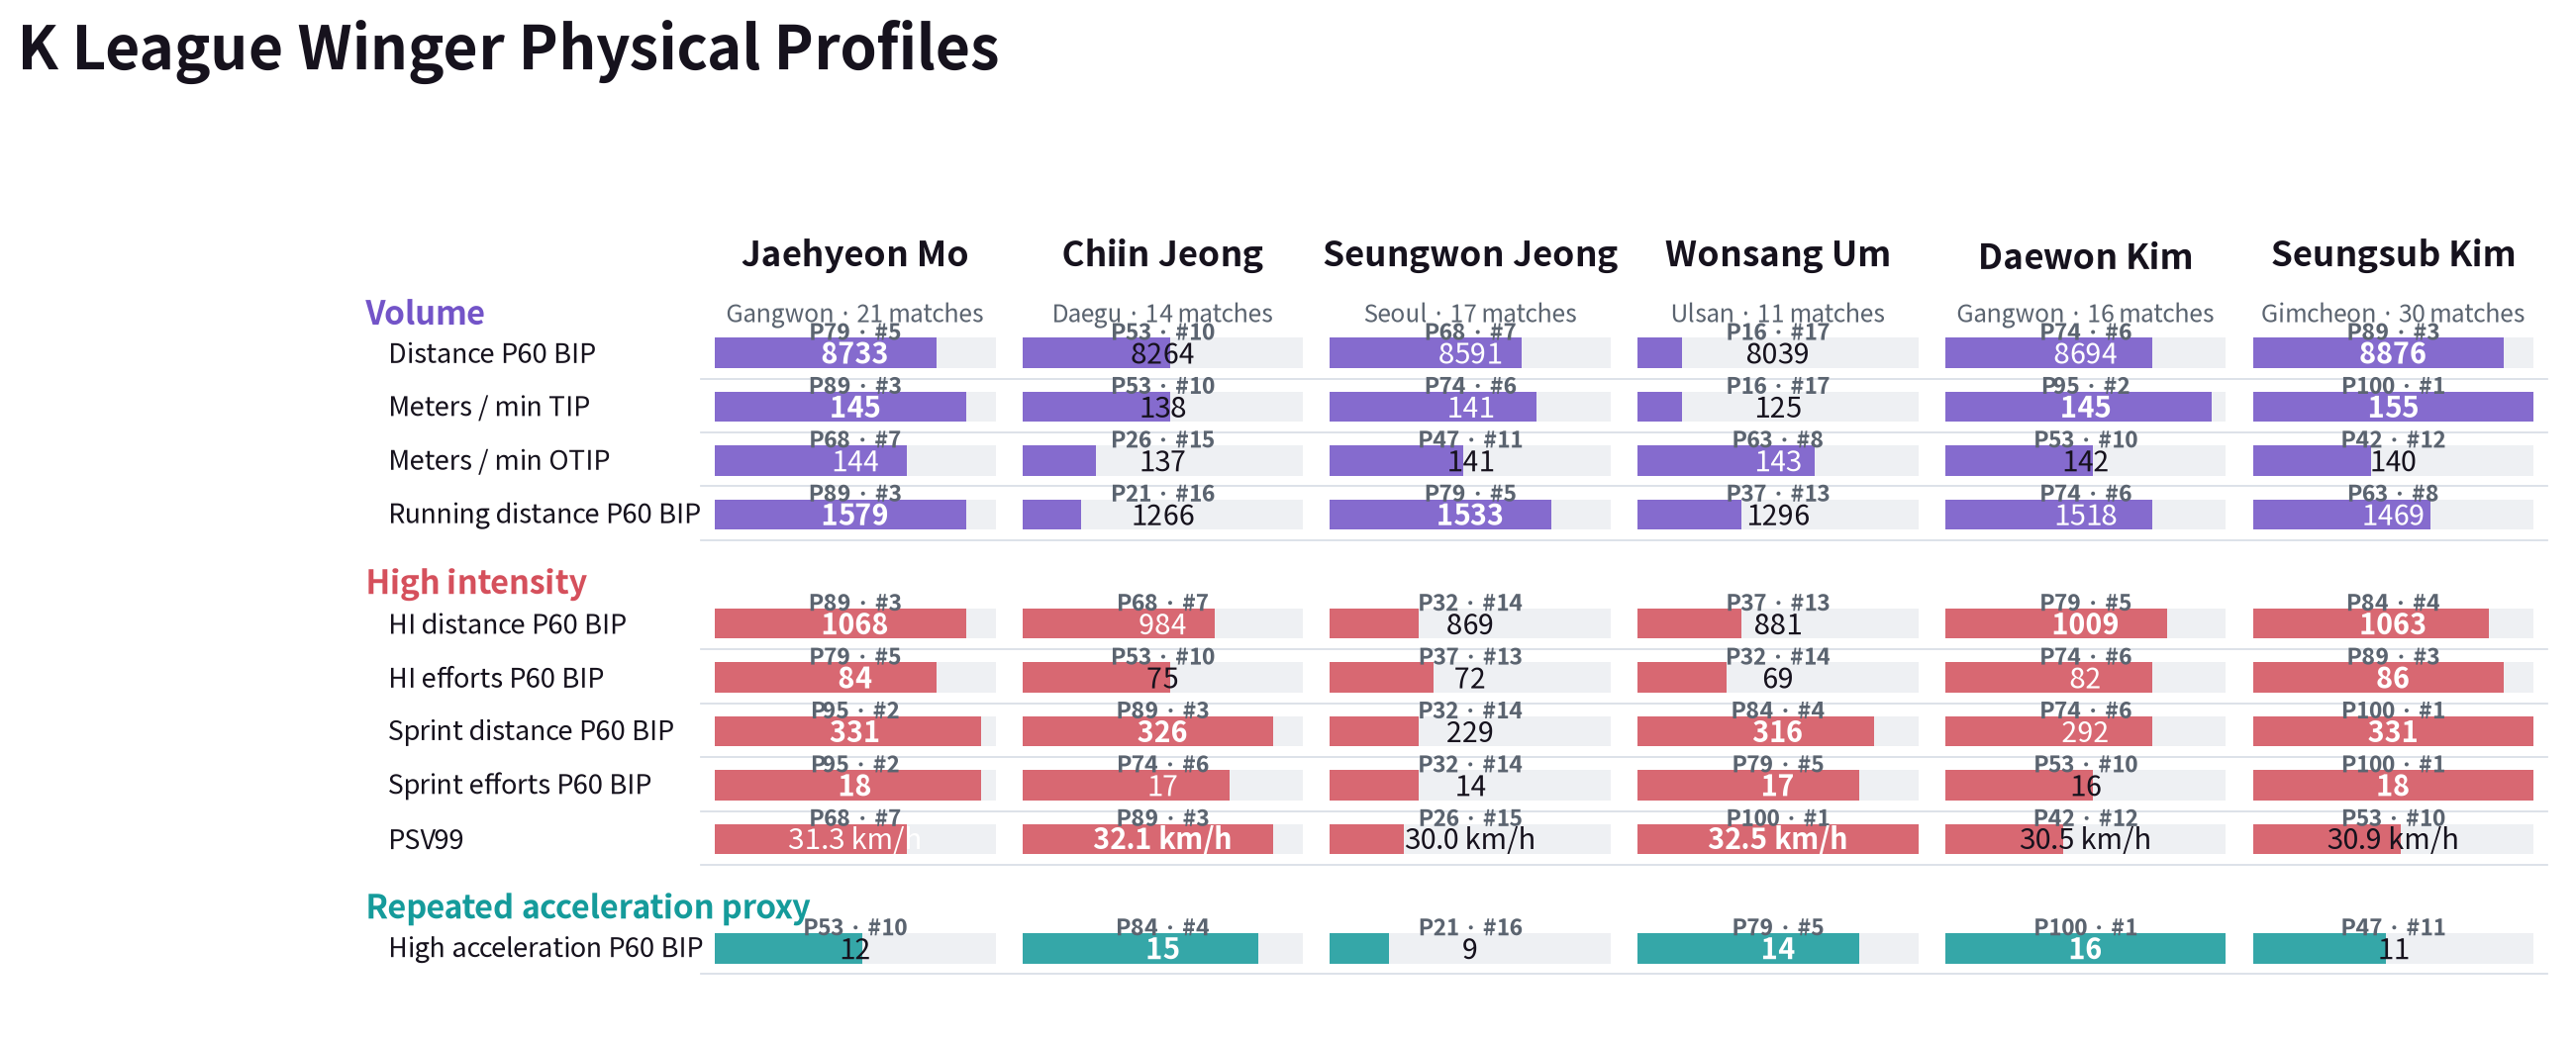
Lined up side by side, these six players reveal at least three distinct types within the single label of "winger."
Seungsub Kim ranks near the top on almost every volume and high-intensity metric. He's first among the six at 155 m per TIP minute, and leads in both sprint distance (331 m) and sprint count (18). His PSV99, though, sits in the middle at 30.9 km/h — he runs a lot, and often, but his outright top speed isn't among the league's very best.
Wonsang Um is the opposite case. His PSV99 of 32.5 km/h is the only one of the six to sit at the 100th percentile league-wide, but his distance per TIP minute is the lowest of the group at 125 m, and his total distance is also the lowest. He's the fastest in an instant, but how often he repeats that speed, and his overall volume, are the lowest of the six.
Even within the single position of winger, there are players who run a lot and often, players with the highest instantaneous speed, players who accelerate repeatedly, and players with a lower high-intensity share. These physical profiles alone can't tell us who the better winger is, but they show clearly that each player moves around the pitch in a distinctly different way.
5. Conclusion: A Physical Metric Is a Starting Point for Questions, Not a Conclusion
This article started from "how much did they run" and widened the question outward — to intensity, possession state, off-ball context, and position.
Activity and high-intensity share turned out to be different questions. Jeonbuk ranked near the bottom on all four measures — activity, high-intensity share, sprints, and BIP-adjusted total distance — and still won the league. Which possession state teams spent their intensity in split differently team by team, and at the player level, the leader in total distance, HSR, sprints, PSV99, and high acceleration was different in every case. Even within the same position — winger — the profiles split apart again.
This mismatch wasn't unique to the 2025 season. Provisional data through round 16 of the 2026 season shows Ulsan, whose physical volume dropped the most, climbing the furthest in the standings, while Jeonbuk, whose volume rose the most, fell. Running more and achieving better results were, at least here, not the same thing.
Of course, these metrics alone can't answer why a particular sprint happened, or settle the causal relationship between physical output and results. A physical metric isn't a conclusion that tells us who ran the most — it's a starting point that tells us which moments are worth watching again.
For questions about the analysis or collaboration, write to thedatadribblers@gmail.com.
Code implementation Sunjae Kweon, Minho Lee
Writing Minho Lee
Review Sunjae Kweon, Minho Lee