
Who had the best pass completion rate in the 2025 K League?
It is a familiar question. Pass completion appears constantly in broadcasts and match reports. But that number can hide an important difference: not every pass has the same difficulty. A short pass from one centre-back to another and a pass threaded into the box under pressure both appear as one completed or missed pass in the event data. The difficulty of those two actions is completely different.
That is why this article uses xPass (Expected Pass Completion) rather than simple pass completion rate. xPass estimates the probability that each pass will be completed, based on information such as the start location, target location, distance, direction, pressure, and receiving context. In other words, xPass asks a different question.
Did this player complete many easy passes, or did he complete difficult passes better than expected?
Using xPass and PAx for 2025 K League players, we can look beneath raw completion rate and separate pass difficulty, role, and execution.
What Is xPass?
xPass estimates the probability that a pass will be completed.
For example, a pass with an xPass value of 0.95 is expected to be completed about 95 times out of 100 in similar situations. A pass with an xPass value of 0.60 is much harder and would be expected to be completed about 60 times out of 100.
xPass commonly uses information such as:
- Pass start and target locations
- Pass distance and direction
- Whether the pass is forward, lateral, or backward
- Possession phase and attacking context
- Defensive lines and nearby pressure
- The receiver's location and situation
So xPass does not only ask whether a pass was completed. It also asks how easy or difficult that pass was expected to be.
From there we can calculate PAx, or Passes Above Expected. PAx subtracts expected completion from the actual pass outcome. A completed pass is counted as 1, a failed pass as 0, and xPass is used as the expectation.
If a player completes a pass with xPass 0.70, he gains +0.30 PAx. If he misses a pass with xPass 0.90, he receives -0.90 PAx. PAx therefore measures not simply who completed many passes, but who completed more passes than expected given the difficulty of their attempts.
When looking at xPass, the first question is not "who completed the most passes?" It is "what kind of passes was each player asked to make?"
We begin by looking at the average xPass of K League players. This tells us who was mostly asked to play relatively easy passes, and who had to take on more difficult passing risk.
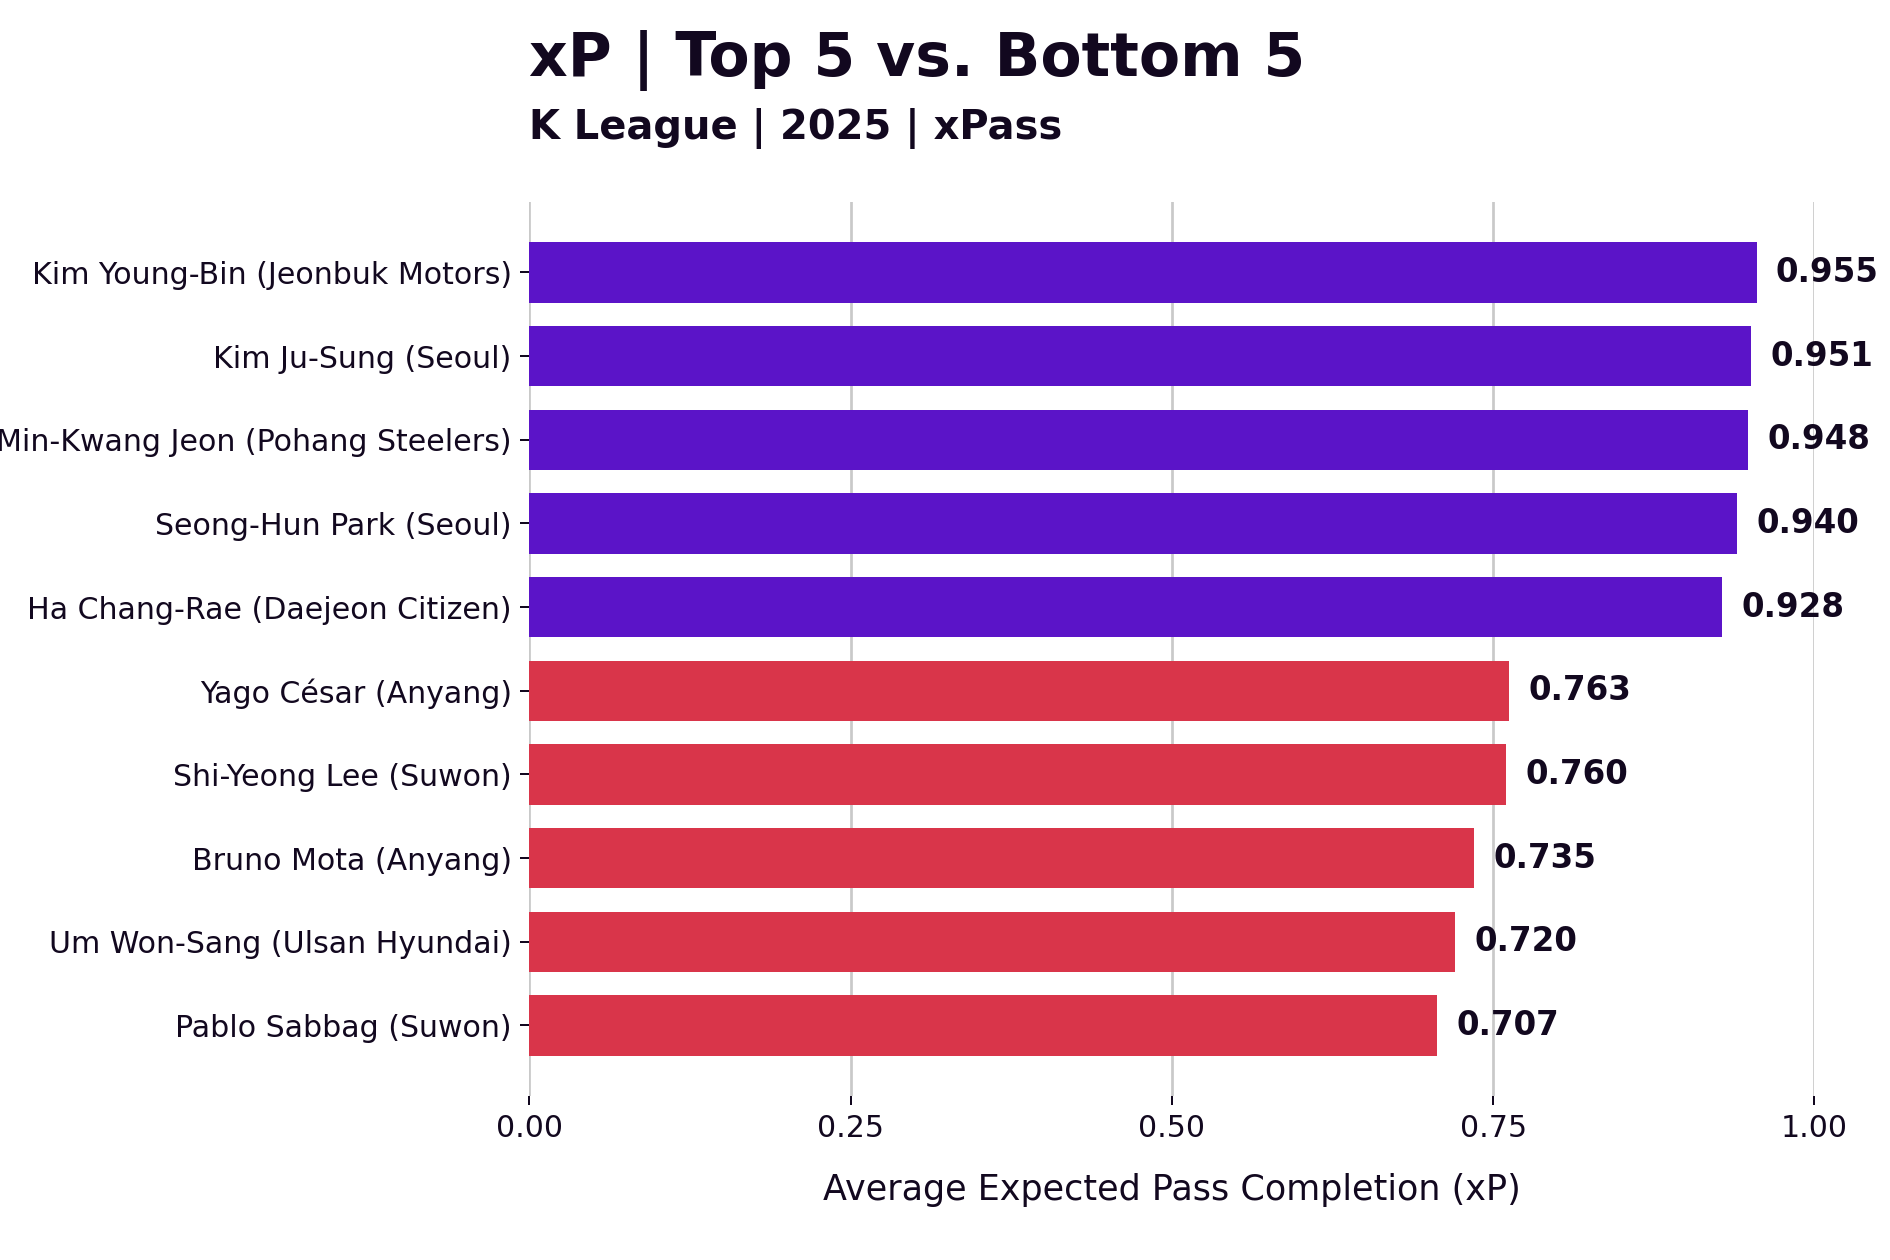
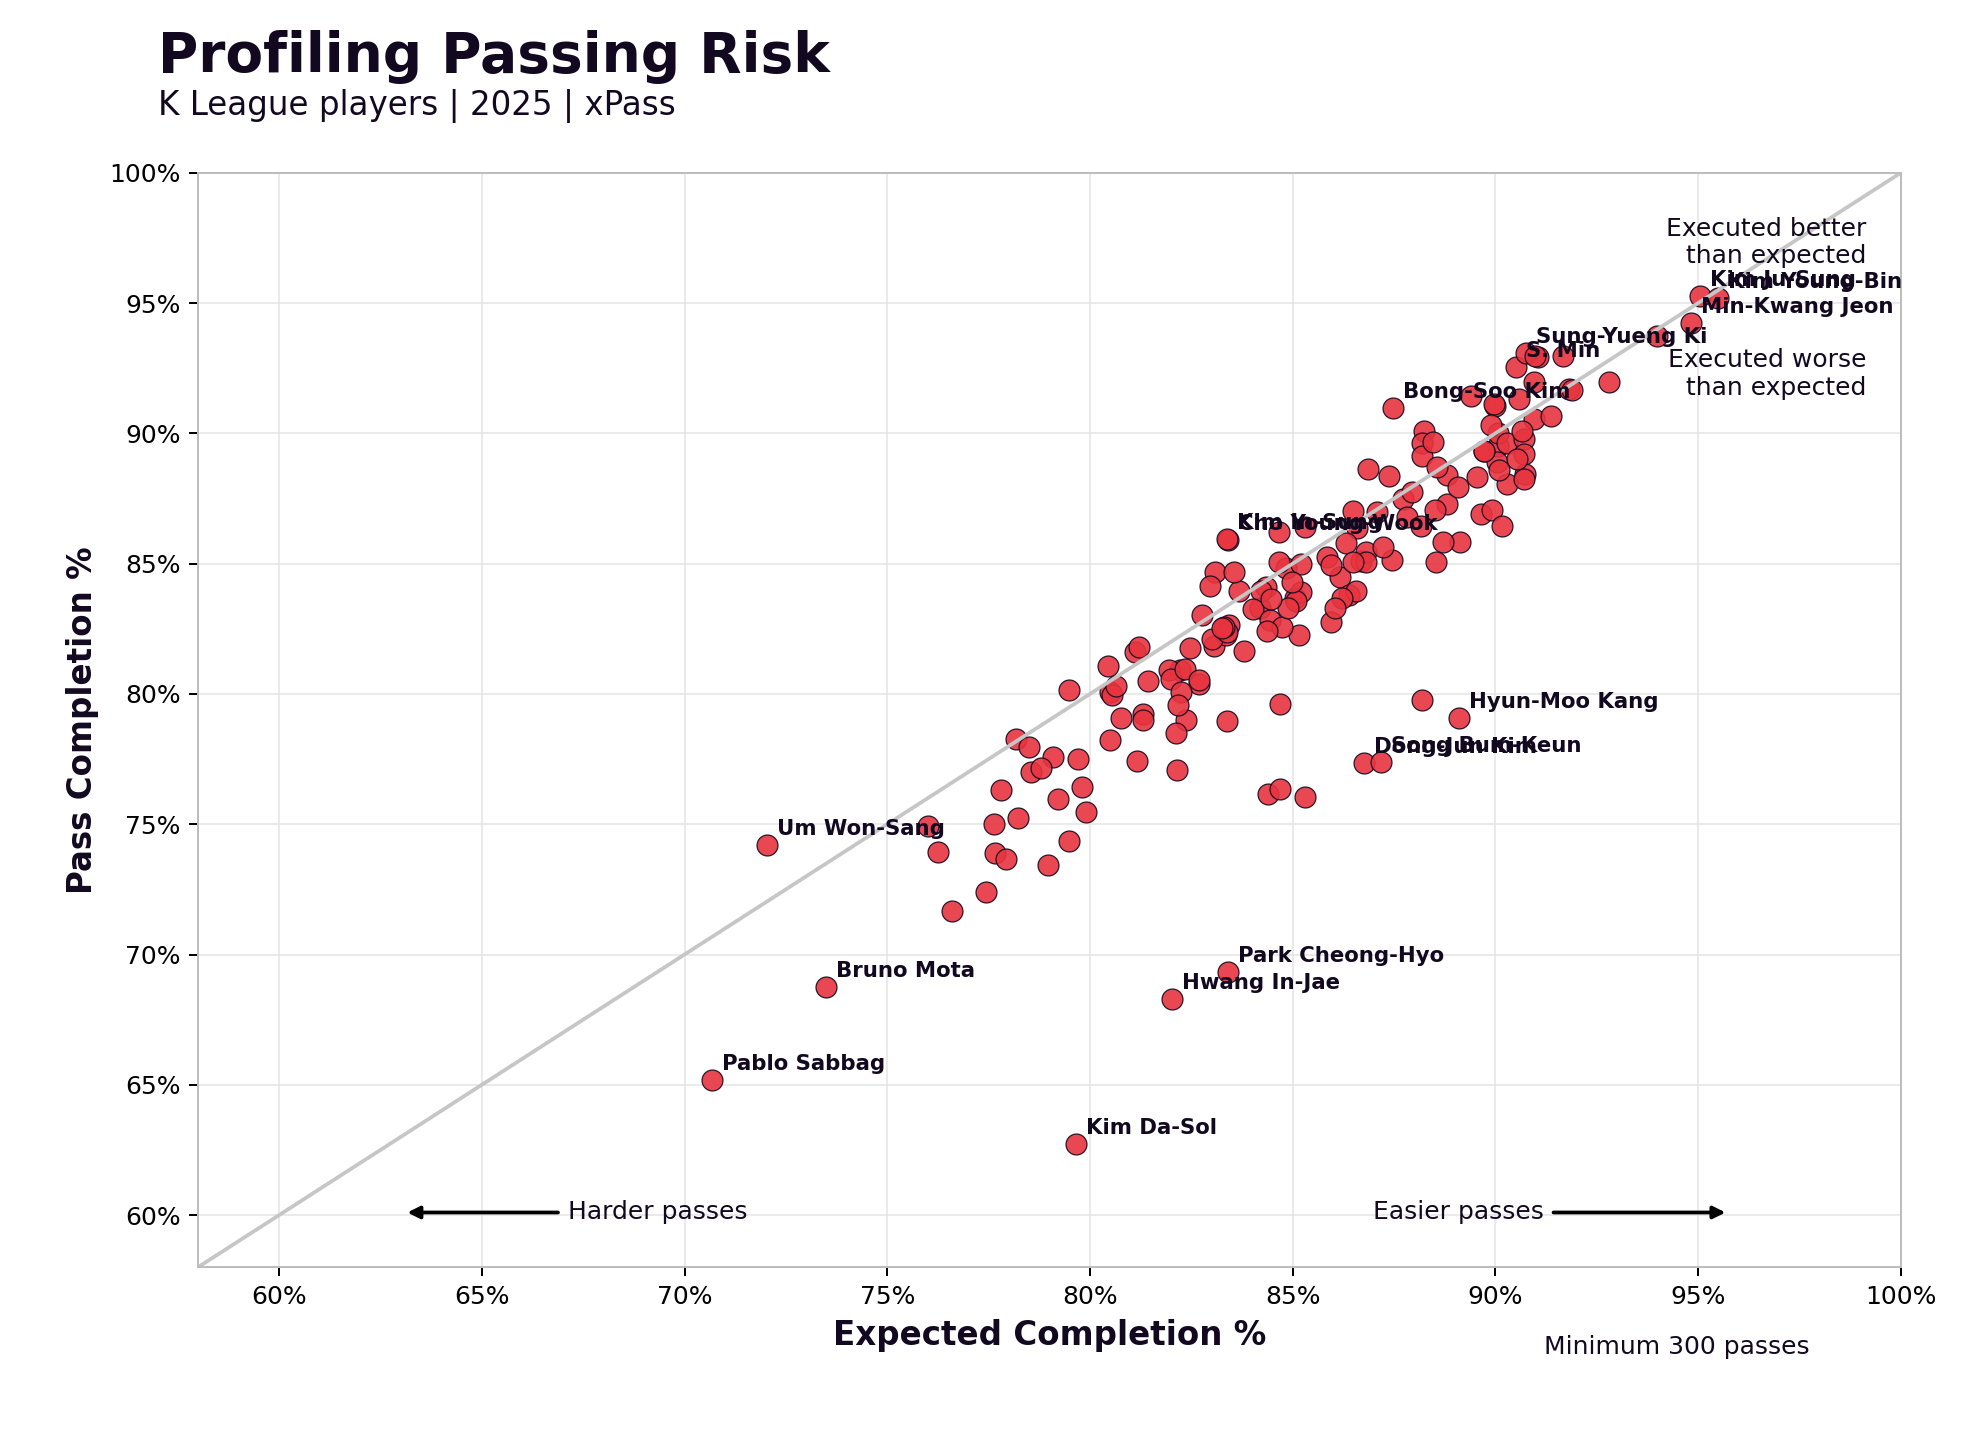
The players with the highest average xPass were Kim Young-Bin, Kim Ju-Sung, Min-Kwang Jeon, Seong-Hun Park, and Ha Chang-Rae. Their average xPass values were generally between 0.93 and 0.96.
This does not mean that they are merely "players who only make easy passes." It more likely reflects their role in stable circulation during build-up. Centre-backs and deeper players often post high completion rates, but their decisions to evade pressure and open the next phase still matter to the team's structure.
At the lower end of average xPass were Pablo Sabbag, Um Won-Sang, Bruno Mota, Lee Shi-Young, and Yago Cesar. These players attempted a higher share of passes from advanced positions, in tighter spaces, and under more difficult timing.
Average xPass is not a good-or-bad ranking. It is a starting point for understanding what kind of passes a player was asked to make and how much risk he carried.
Who Completed More Than Expected?
The next metric is PAx.
PAx creates separation even among players with similar completion rates. A player who completes harder passes can record a higher PAx. A player who misses easy passes can have a lower PAx even if his raw completion rate does not look especially poor.
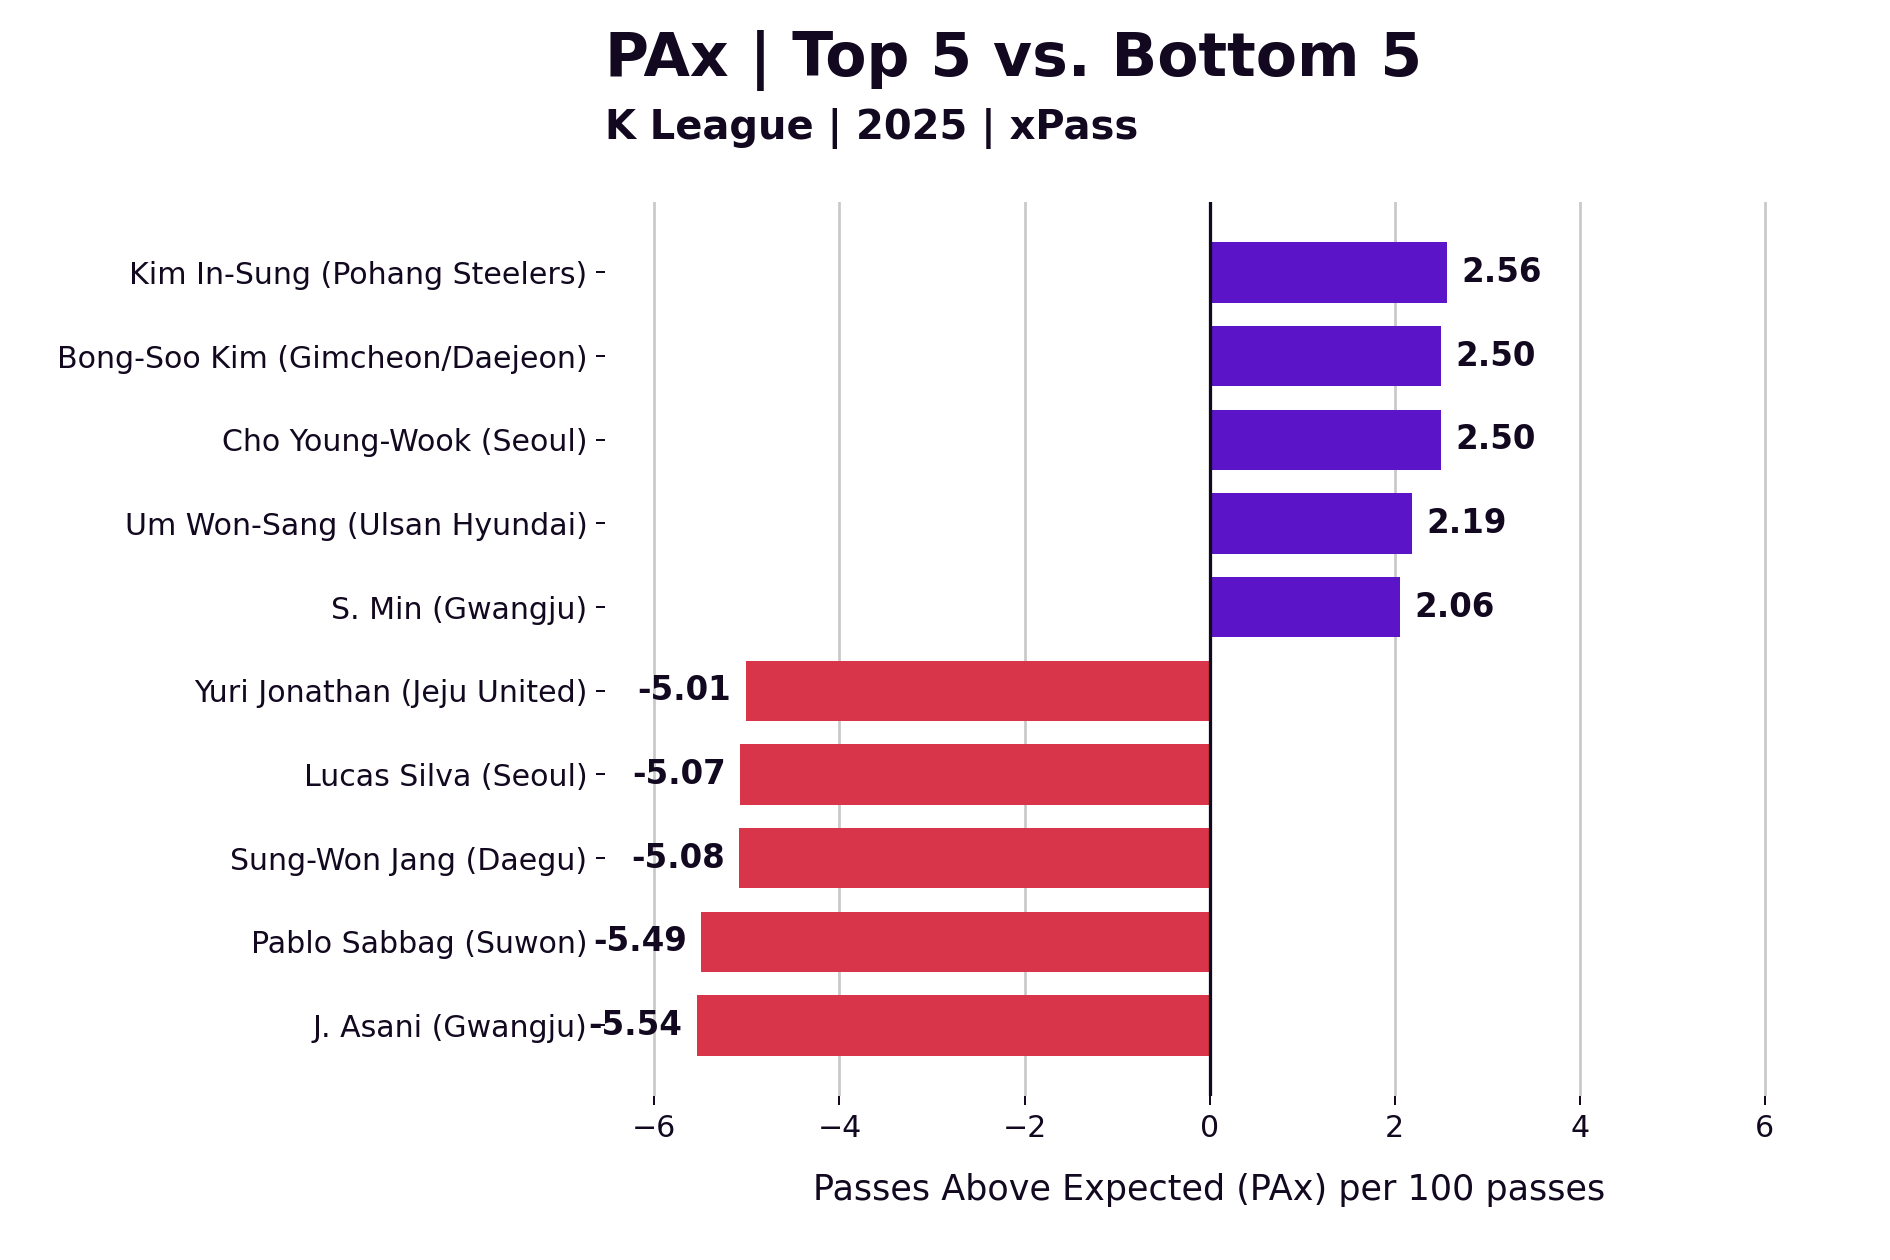
The 2025 PAx/100 leaders were Kim In-Sung, Bong-Soo Kim, Cho Young-Wook, Um Won-Sang, and S. Min. They were not simply high-completion players. They completed more passes than expected given the difficulty of the passes they attempted.
Kim In-Sung recorded the highest value. Across 306 passes, he completed 85.9% of them and posted a PAx/100 of +2.56. In other words, for every 100 passes of similar difficulty, he completed about 2.6 more passes than expected.
Bong-Soo Kim ranked second when his Gimcheon Sangmu and Daejeon Citizen spells were combined by player ID: 1,091 passes, a 91.3% completion rate, and a PAx/100 of +2.50. Looking only at his Daejeon spell, his PAx/100 was +3.48, the highest stint-level figure in the league.
After excluding goalkeepers because of their positional specificity, the lowest PAx players were J. Asani, Pablo Sabbag, Sung-Won Jang, Lucas Silva, and Yuri Jonathan. This should not be read automatically as poor passing ability. Completion rate and PAx are strongly affected by role and pass selection. Still, these players completed fewer passes than expected given their pass difficulty, with losses likely accumulating in high-risk actions such as attacking combinations, crosses, and forward passes.
How Did the PAx Leaders Differ?
We can also look at pass maps for players near the top of the PAx ranking.
Purple lines show completed passes that added more value than expected. Red lines show missed passes with a large loss relative to expectation. These maps do not show every pass. They highlight only the actions where the PAx difference was large enough to reveal a player's passing profile.
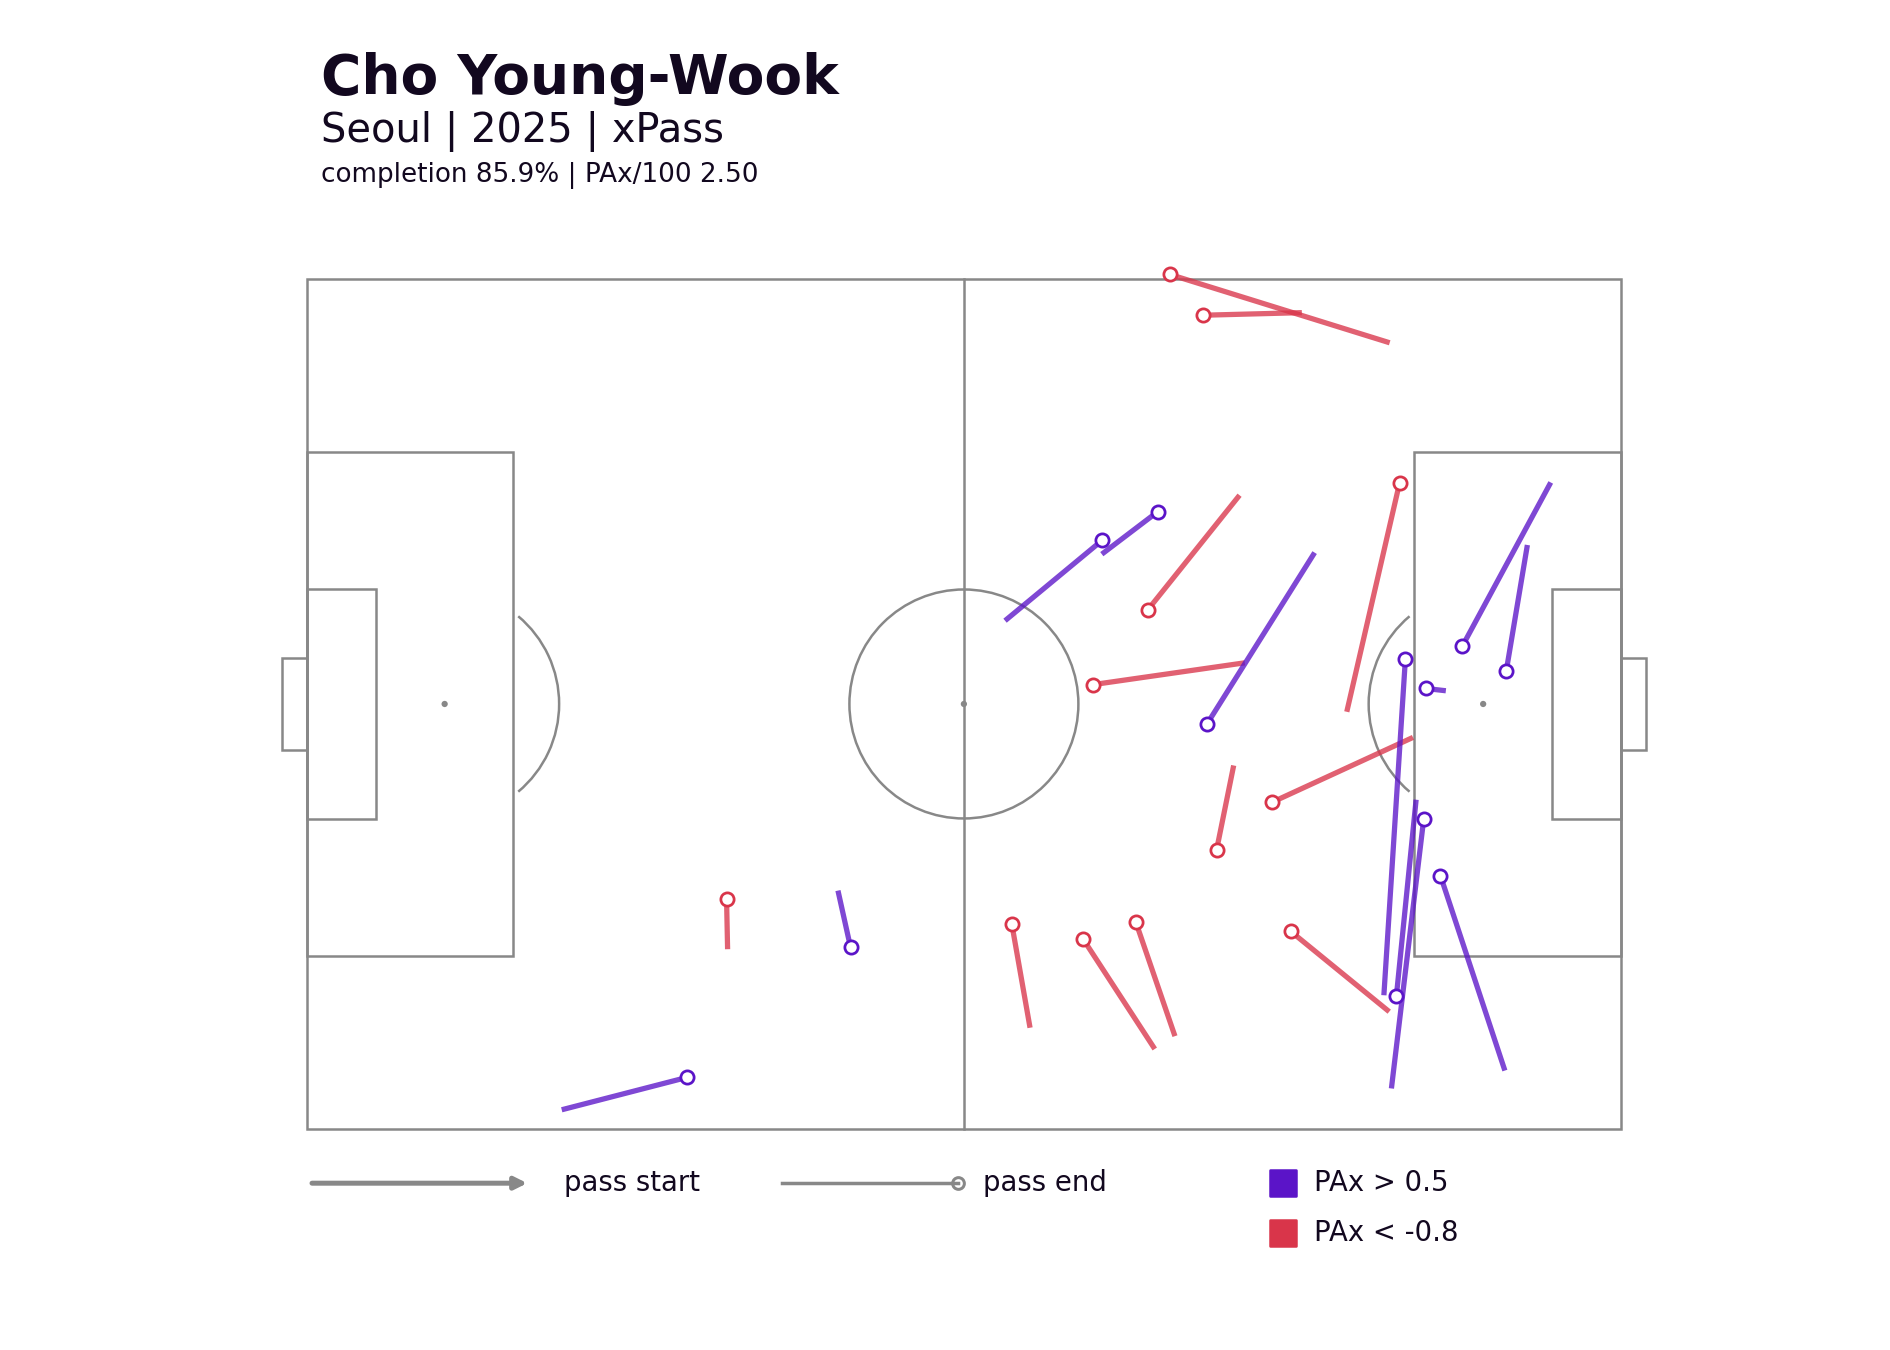
Cho Young-Wook's pass map is a useful example of how to interpret an attacker's completion rate.
His pass completion rate was 85.9%. Compared with defenders or deep midfielders, that may not look especially high. But the locations change the story. Several difficult completed passes appear in advanced areas, near the box, and especially in the right attacking channel.
Passes in attacking areas are made under stronger pressure and with passing lanes closing quickly. Completing more than expected in those areas reflects attacking connection, not just safety.
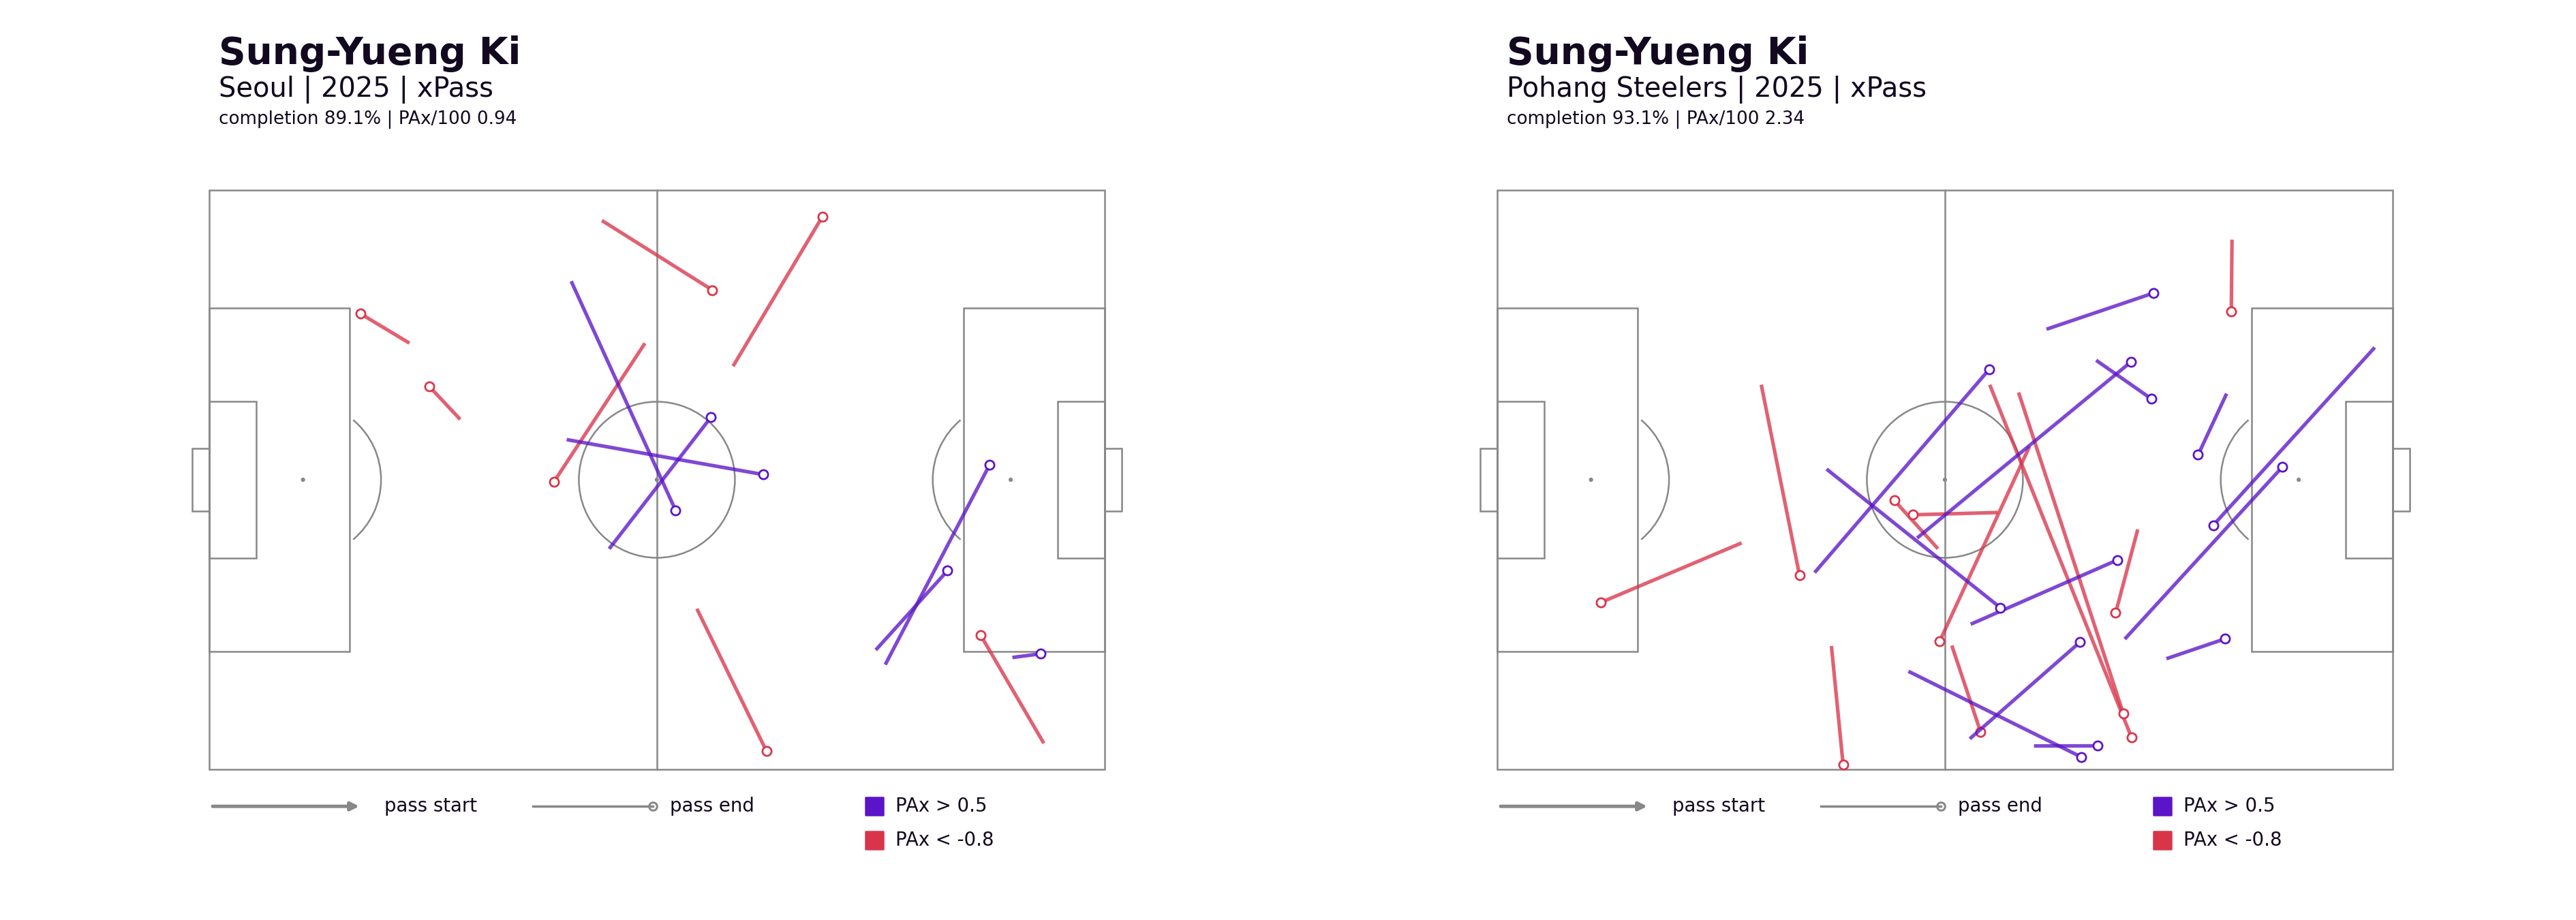
Sung-Yueng Ki played for both Seoul and Pohang Steelers during the season, so a single season-level number blends together different teams and roles. His Seoul pass map contains both positive completions and costly misses, but they are not strongly concentrated in one zone or direction. His PAx/100 was still positive at +0.94, but the pattern of overperformance was relatively dispersed.
At Pohang, the picture is clearer. His PAx/100 rose to +2.34, and more of his above-expected completions came from midfield passes into advanced or wide areas. This should be read not only as an individual passing trait, but also as the product of his role at Pohang, the movement around him, and the angles and space available to receivers.
One detail is worth noting: several red passes went from the left side toward the right advanced area. Ki can switch play and connect forward from midfield, but that pass was not always reliably completed. When opponents closed the right-side forward option early, or when pressure arrived quickly around the receiver, the outcome fell below expectation.
This creates a tactical hint for both sides. For Ki's own team, the receiving player on the right side may need a better angle and more space before the switch is played. For opponents, when Ki receives the ball on the left, they can design pressure to guide him toward a specific passing option and then close the receiver early.
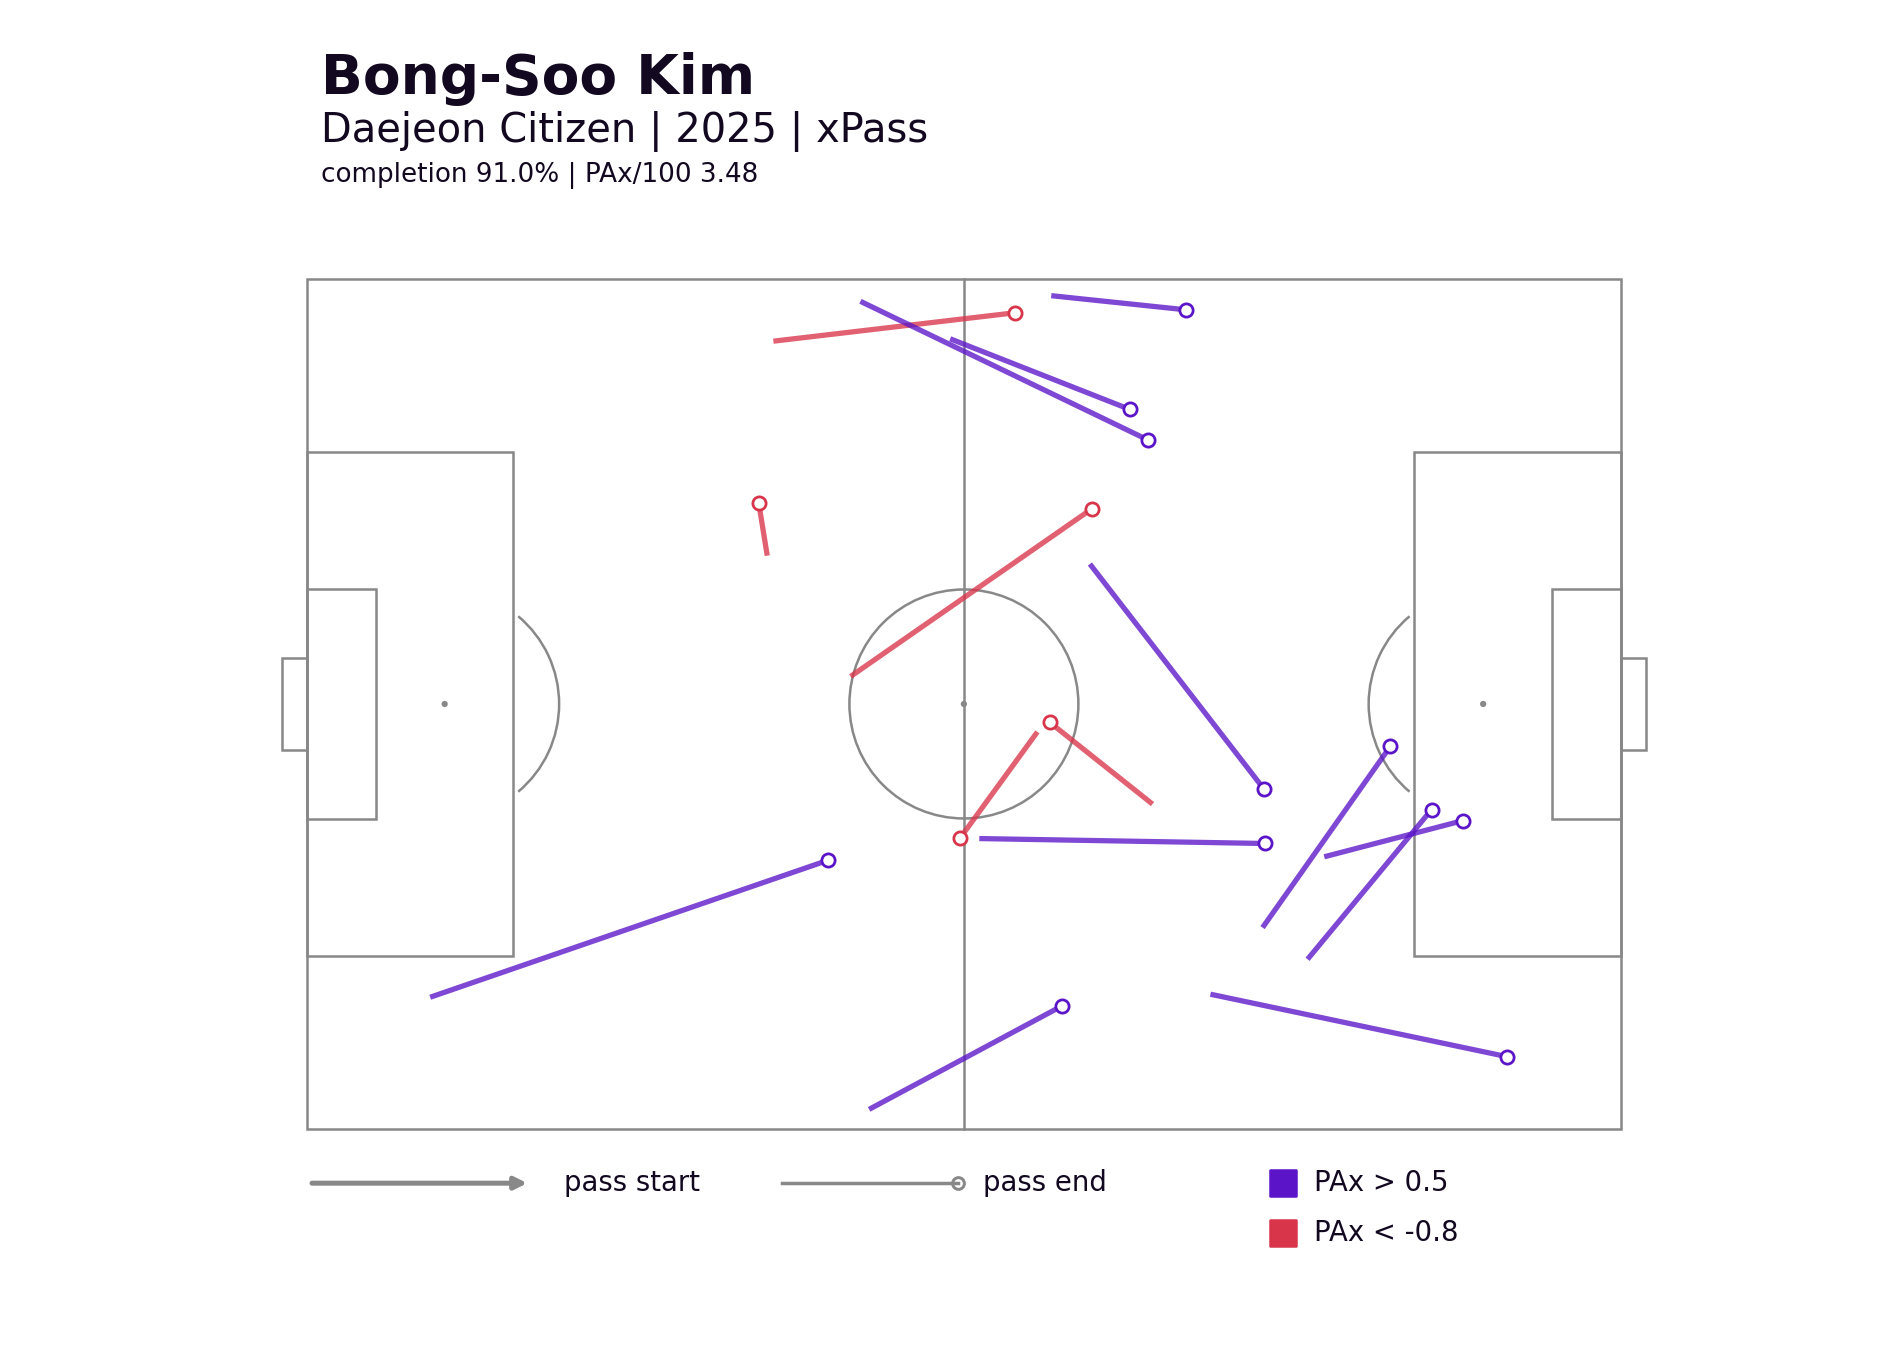
Bong-Soo Kim's map shows that his value was not concentrated in one area. Purple passes appear across midfield, wide areas, and forward connections. His season-level completion rate was also high at 91.3%, and that number was not built only on repeated easy passes. The forward passes from central areas toward the right side or into the attacking half stand out. If Cho Young-Wook was close to the final attacking connection, and Ki used switches to stretch the pitch, Kim was closer to the midfielder who moved the ball into the next zone.
This kind of player can be less visible in a team's possession. But xPass reveals the contribution: stable circulation with more completed passes than expected.
What an 85% Completion Rate Cannot Tell Us
Pass completion rate tells us the outcome. It does not tell us how difficult the pass was.
Is an 85% completion rate a good number?
The answer is: it depends.
If a player mostly makes easy passes from deep areas, 85% may be disappointing. If a player repeatedly attempts difficult passes in attacking areas, 85% can be excellent.
xPass lets us separate those cases. Completion rate shows the result. xPass shows the difficulty behind that result. PAx then shows who performed better than expected after accounting for that difficulty.
Good passers identified through xPass do not all look the same. Some circulate possession safely from the back. Some complete difficult connections in attacking areas. Some change the direction of play with long switches. Others create small advantages from midfield over and over again.
Pass completion rate is a useful starting point. But it cannot fully explain the value of a player's passing on its own. We also need to know where the pass was made, who it was played to, how much pressure was present, and what the pass was trying to achieve.
Only then does "good passer" become a more specific and useful phrase.
For questions or collaboration inquiries, contact thedatadribblers@gmail.com.