
In 2024, FC Seoul appointed Kim Gi-dong as head coach.
Expectations were high. At Pohang, Kim had built a well-structured team despite limited resources, and Seoul wanted that same kind of stability.
The first season went reasonably well. Seoul reached Final A in 2024 and finished fourth with 58 points. The league table told a simple story: a good coach had arrived, and Seoul had improved.
But the course of the 2025 season made that judgment more difficult. It was the second year under the same coach and the same direction, yet the results did not meet expectations.
That changes the question.
Was Seoul really improving? Was the strong 2024 finish supported by the underlying performance? Did the turbulence of 2025 truly reflect a decline in performance?
To answer these questions, this article uses expected goals, or xG.
xG assigns a probability to a shot becoming a goal. Goals show the outcome; xG describes the quality of the chances created before that outcome.
Here, xG is not treated as a final answer. It is a tool for breaking Seoul's attack into clearer questions: Were they creating good chances? Did those chances become goals? And how did Kim Gi-dong's attacking structure change between 2024 and 2025?
What Is xG?
xG is a measure of shot quality.
Every attempt is recorded as one shot, but not every shot has the same chance of becoming a goal. A shot from directly in front of goal is fundamentally different from a long-range attempt outside the penalty area.
xG expresses that difference numerically.
For example, a shot with an xG value of 0.10 is scored about once in every ten similar situations. An xG value of 0.50 represents a high-quality chance that is converted about half the time.
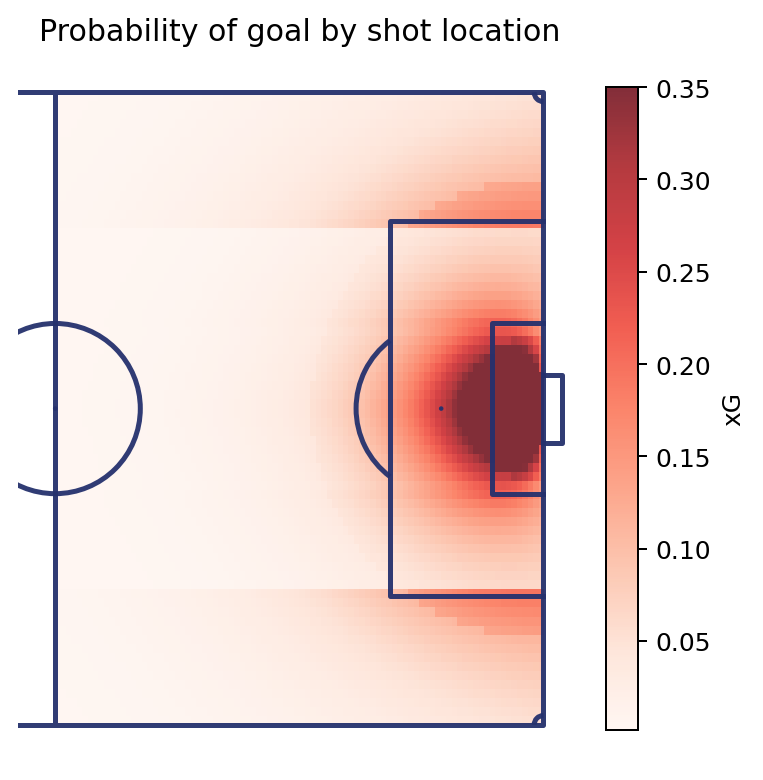
How are these probabilities calculated?
xG models are trained on large collections of historical shots. They learn whether each shot became a goal and the circumstances in which it was taken. When a new shot is observed, the model estimates its scoring probability from how often similar attempts were converted in the past.
Common inputs include:
- Shot location
- Distance from goal
- Shooting angle
- Body part used
- Type of preceding pass
- Open-play or set-piece context
- Defensive pressure
Even two shots from inside the penalty area can receive different xG values. A central attempt taken with time and space is different from a shot under pressure from a narrow angle.
A team's match xG is the sum of the xG values of all its shots. A high xG total therefore means more than simply taking many shots; it generally indicates the creation of more high-probability chances.
xG does not explain everything. Elite finishers can score from low-xG chances, and elite goalkeepers can prevent goals from high-xG situations. Different xG models also produce different estimates.
Still, xG is a useful starting point for evaluating attack. Goals show the result, while xG shows the opportunities a team created before the result.
Revisiting the 2025 K League 1 Table Through xG
Before focusing on Seoul, let us reconsider the league as a whole through xG.
The table shows the points each team earned. xG shows how well teams created good chances and prevented their opponents from doing the same. Looking at both helps us assess whether the standings and the underlying performance point in the same direction.
Three metrics are central here:
- xG: the total expected value of a team's shots
- xGA: the expected value of the shots a team conceded
- xGD: xG minus xGA, combining chance creation and chance prevention
A high xGD does not simply mean that a team attacked well. It means that the team created good chances while limiting the quality of its opponents' chances. That makes xGD a useful first measure of overall performance.
League positions, however, are determined by points rather than goal difference. We therefore also use xPoints. Based on each match's xG, xPoints estimates how many points a team could expect from that level of performance.
In short, xGD describes the direction of performance, while xPoints translates that performance into expected league points.
| Actual rank | Team | Points | xPoints | Overall xPoints rank | xGD/match | Overall xGD rank |
|---|---|---|---|---|---|---|
| 1 | Jeonbuk | 79 | 61.4 | 2 | +0.402 | 2 |
| 2 | Daejeon | 65 | 50.7 | 6 | -0.076 | 6 |
| 3 | Gimcheon | 61 | 56.5 | 4 | +0.183 | 4 |
| 4 | Pohang | 56 | 54.9 | 5 | +0.094 | 5 |
| 5 | Gangwon | 52 | 47.2 | 10 | -0.205 | 10 |
| 6 | FC Seoul | 49 | 62.5 | 1 | +0.424 | 1 |
| 7 | Gwangju | 54 | 47.7 | 9 | -0.138 | 8 |
| 8 | FC Anyang | 49 | 48.1 | 8 | -0.157 | 9 |
| 9 | Ulsan | 44 | 58.3 | 3 | +0.209 | 3 |
| 10 | Suwon FC | 42 | 48.3 | 7 | -0.115 | 7 |
| 11 | Jeju | 39 | 46.9 | 11 | -0.285 | 11 |
| 12 | Daegu | 34 | 43.9 | 12 | -0.336 | 12 |
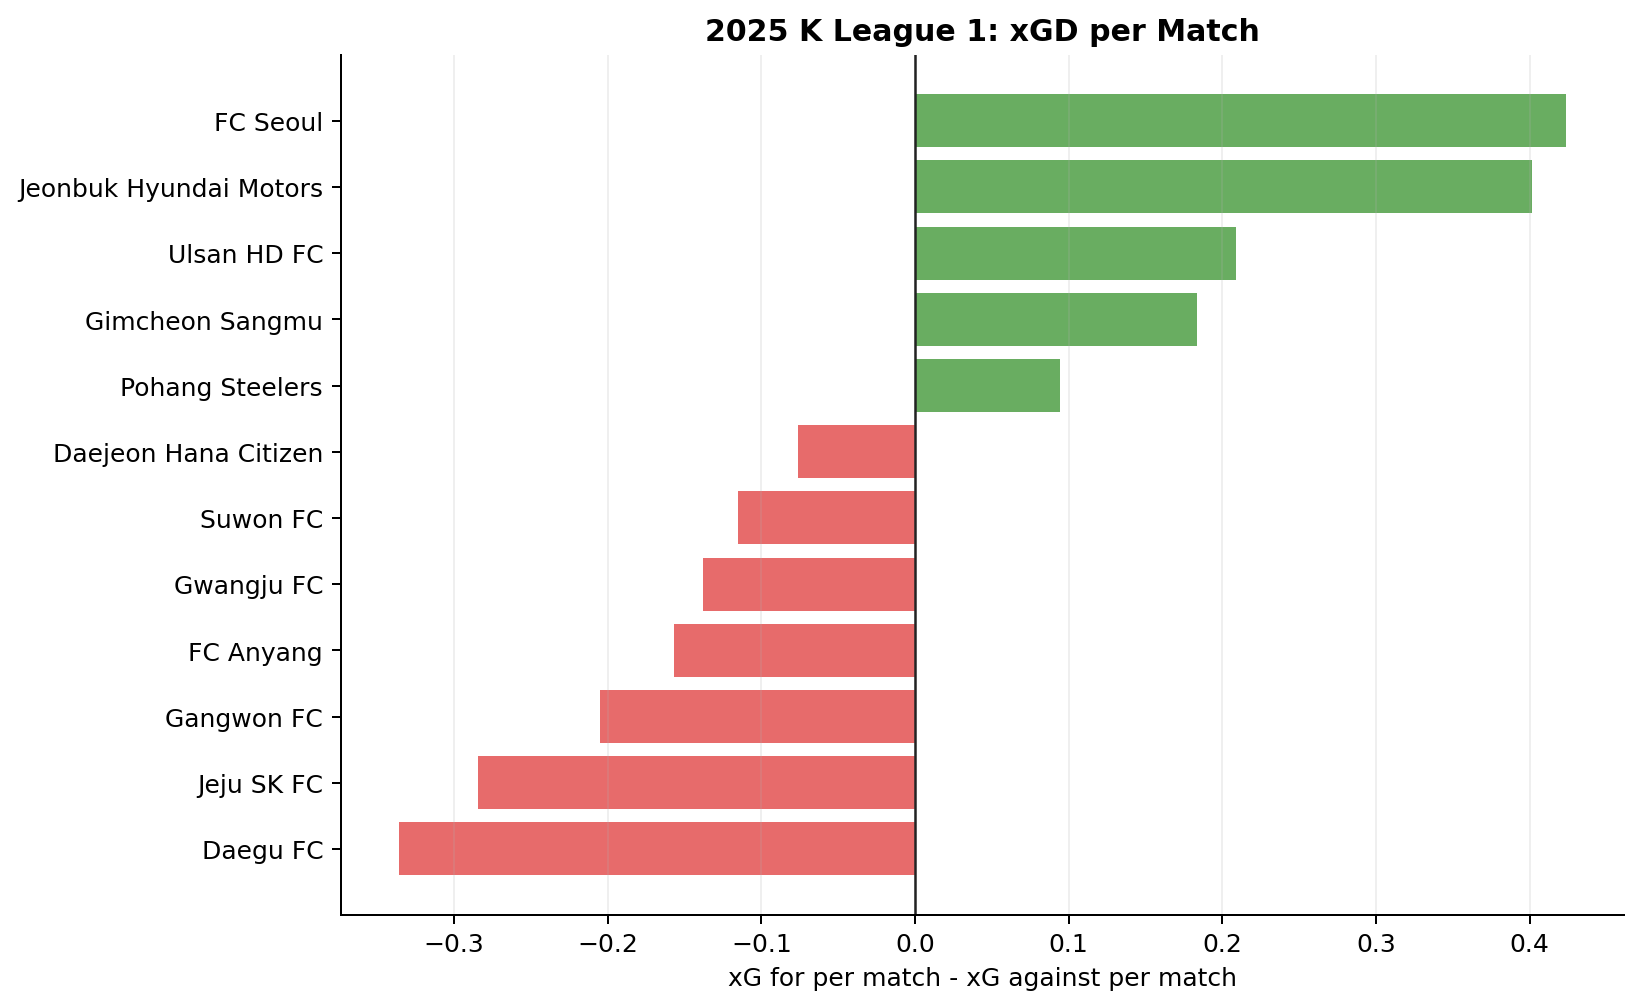
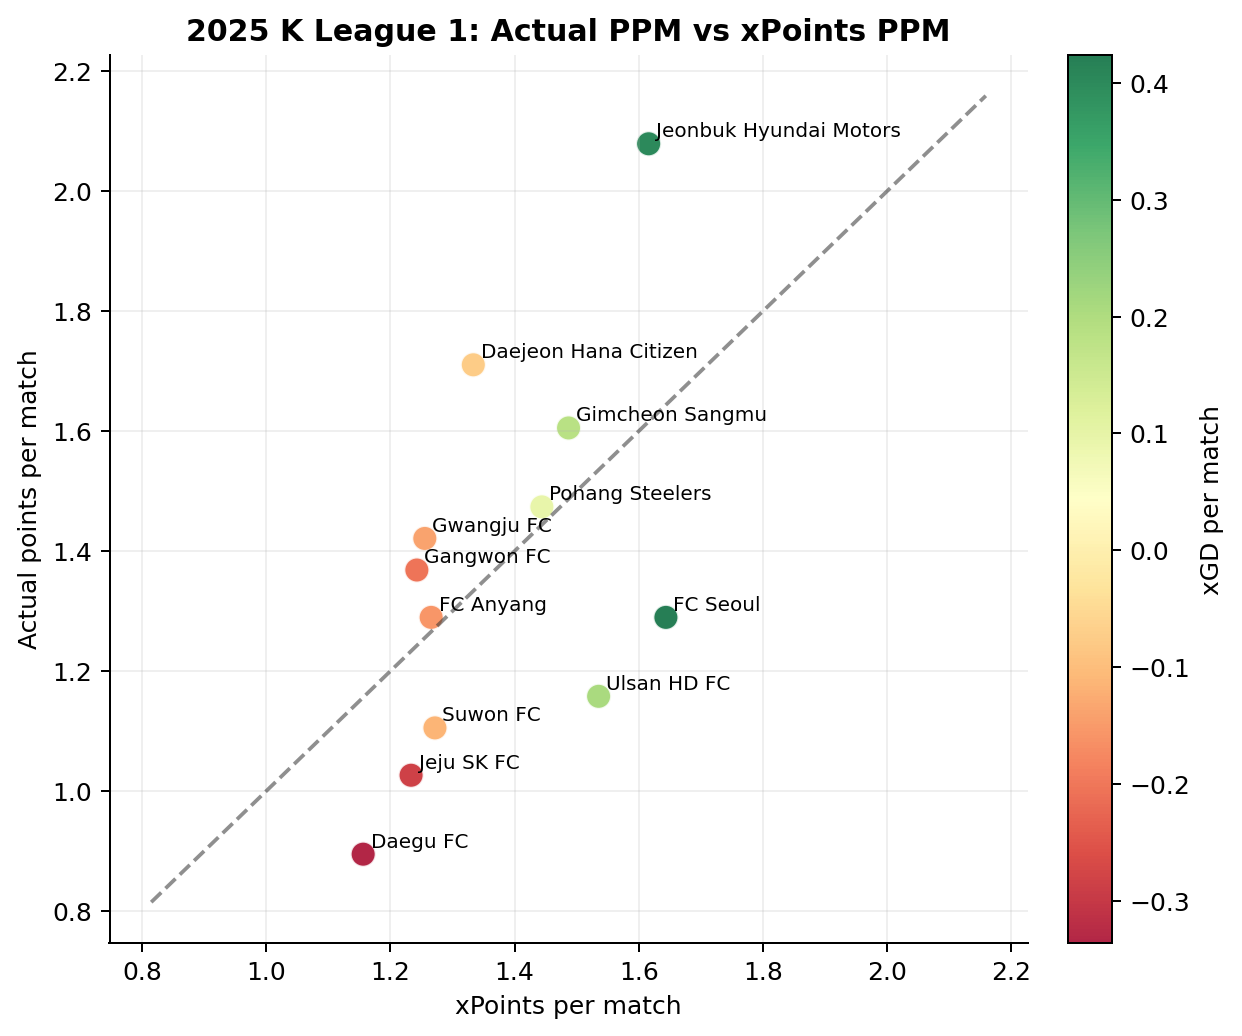
FC Seoul is the first team that stands out.
Seoul finished sixth, but ranked first in both overall xPoints and xGD. The table presents a mid-table side, while xG describes a team that created and prevented chances at the best level in the league.
Seoul also sits well below the diagonal in the second chart. The team earned 49 points, about 13.5 fewer than the model's estimate of 62.5. In other words, strong underlying performance did not translate fully into results.
Jeonbuk, by contrast, finished first and ranked second in both overall xPoints and xGD. Their performance was worthy of a title contender, but their actual total was still about 17.6 points above expectation.
Daejeon finished second but ranked sixth in both overall xPoints and xGD, making them a clear example of results outperforming the underlying numbers. Gimcheon finished third and ranked fourth in both metrics, so their table position and performance indicators were relatively well aligned.
Seoul's 2025 season is therefore difficult to describe simply as a season of poor performance. It was closer to a season in which league-leading underlying numbers failed to become points and position.
Where Did Seoul's xG Come From?
As we have seen, xG rated Seoul more highly than the final league table did.
The next question is where that difference came from. Did Seoul lose value in attack, or did they concede more than the quality of their defensive chances suggested?
We begin by comparing goals with xG, and goals conceded with xGA.
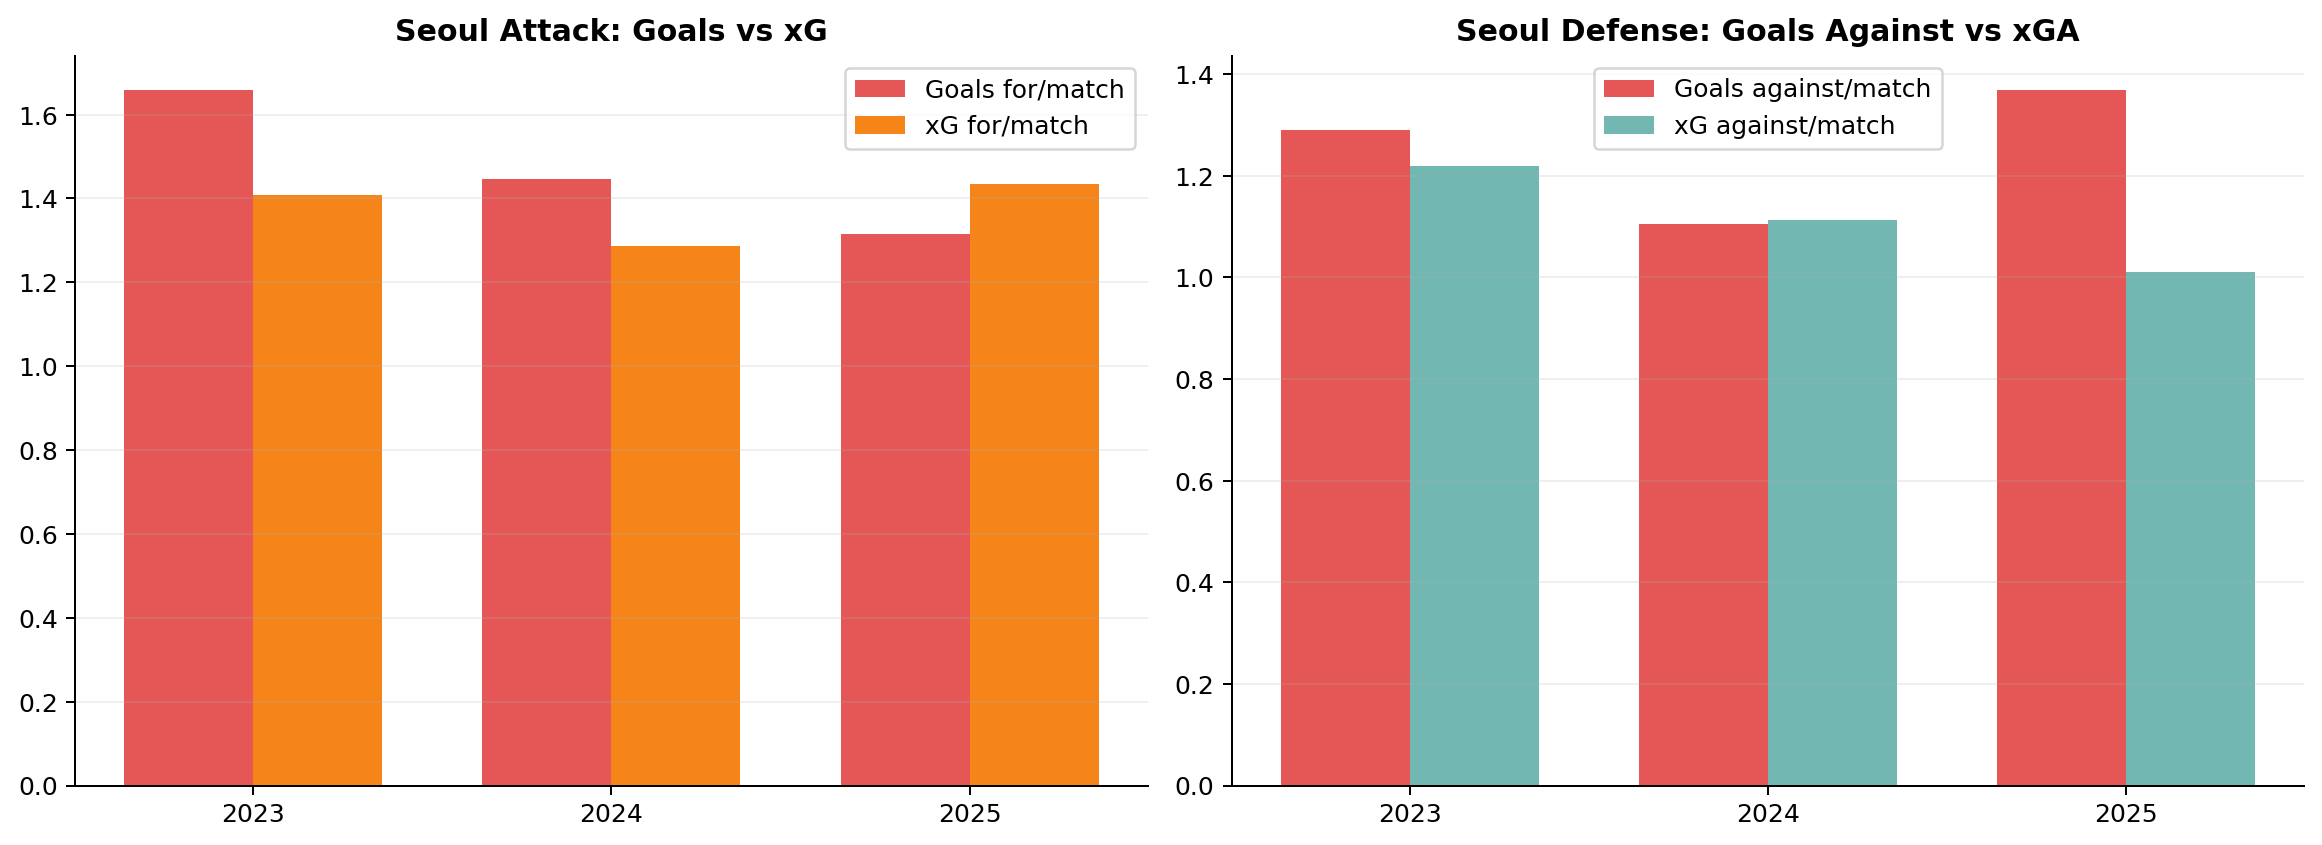
In 2024, Seoul scored about six more goals than their xG total suggested.
In 2025, they scored 50 goals from approximately 54.5 xG. That was about 4.5 goals below expectation. Their finishing did not collapse, but it would also be inaccurate to say that they converted the full value of their chances.
The larger difference appeared in defense.
Seoul's xGA fell to about 38.4 in 2025, lower than in 2024, yet their actual goals conceded rose from 42 to 52. They allowed approximately 13.6 more goals than the expected value of the chances they faced.
Seoul were not primarily a team that repeatedly conceded high-quality chances. They were a team that conceded far more goals than their xGA suggested. There was also a shortfall in attack, but the larger gap behind the disappointing results came at the defensive end.
How, then, did the structure of Seoul's shooting change?
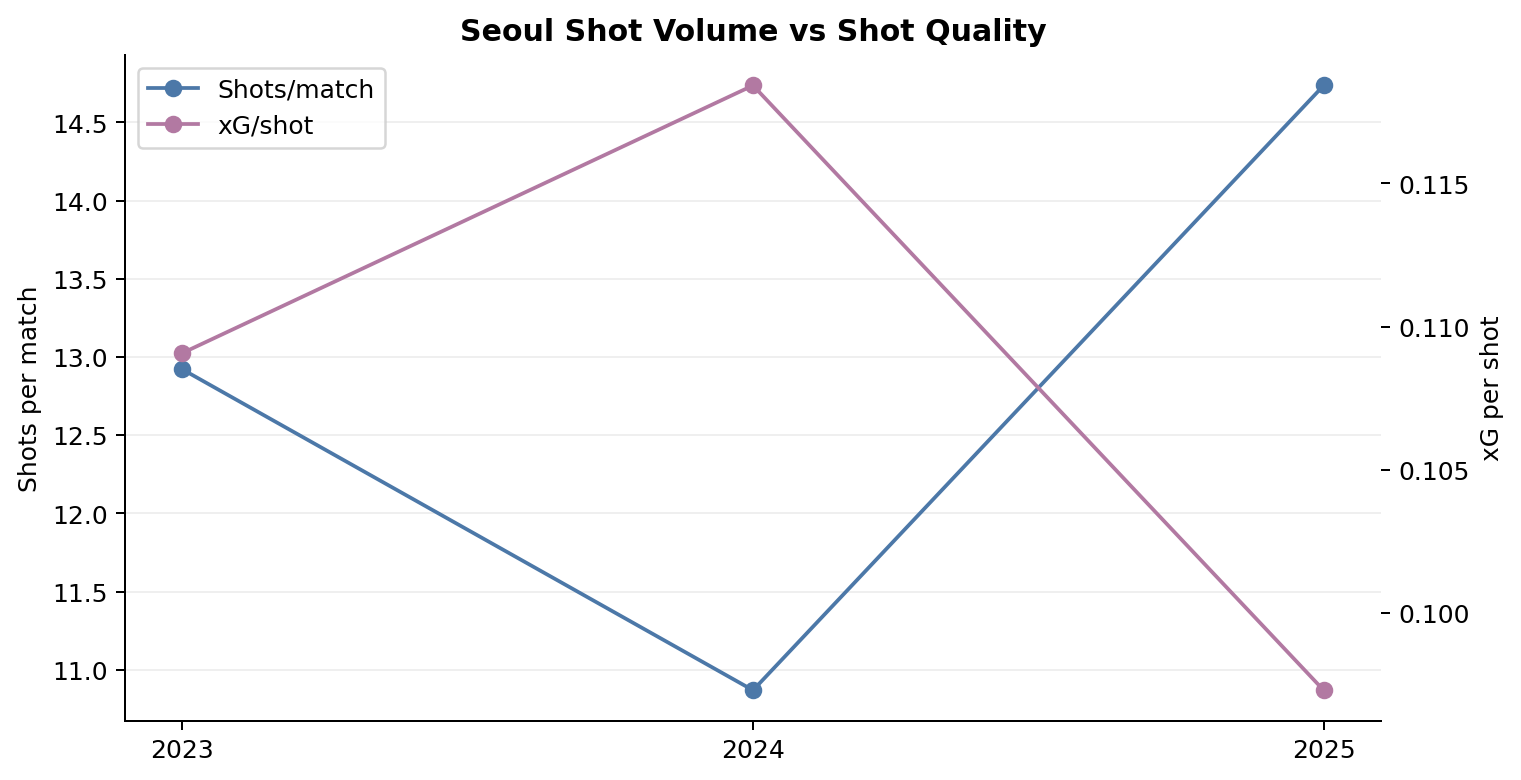
Seoul took substantially more shots in 2025, but their xG per shot fell.
They shot more often, but not from better locations. The volume of attack increased while the average threat of each attempt declined.
Seoul's attack did not completely break down in 2025. Total xG increased, but goals fell below expectation and shot quality declined. At the other end, the team conceded far more than its xGA. That helps explain why an elite xG profile did not produce an elite league position.
Rolling xGD: When Did Seoul Begin to Change?
Season totals show averages, but changes in team performance can be hidden inside those averages.
To examine the match-by-match trend, we use five-match rolling xGD, the average xG difference over a team's most recent five matches.
A value above zero means that Seoul produced the stronger xG balance over those matches. A value below zero means their opponents produced the better chance profile.
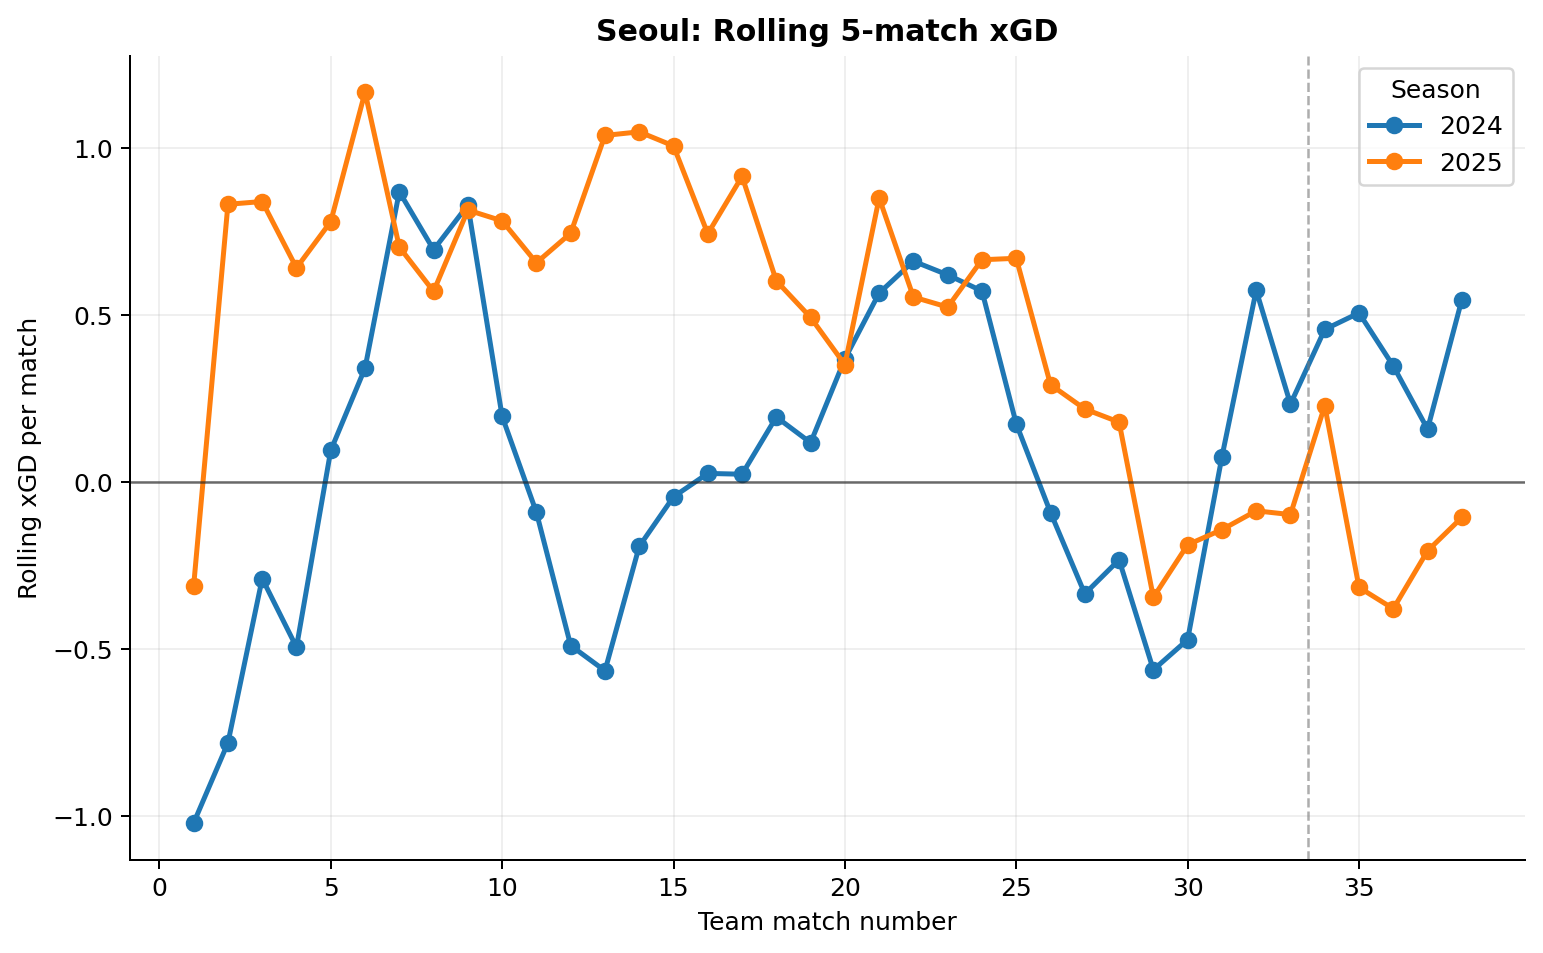
The first visible difference is the starting point.
Seoul began 2024 with a strongly negative rolling xGD. It improved after the first five matches, and positive stretches became more common later in the season. The quality of the team's performances improved as the season progressed.
The 2025 pattern was different. Seoul moved into positive territory early, and around match 15 their rolling xGD exceeded one expected goal per match during a particularly strong stretch.
The problem came later. The trend declined after match 26, and the metric returned to negative territory toward the end of the regular season and again late in the final round.
Seoul were not a poor team from the beginning of 2025. For most of the season, they created and prevented chances more consistently than in 2024. They failed to turn that advantage into enough points, however, and the underlying performance also declined from the final stages of the regular season.
How Seoul's Shot Profile Changed
We can now examine Seoul's shot maps.
The first and most obvious change is the increase in shot volume.
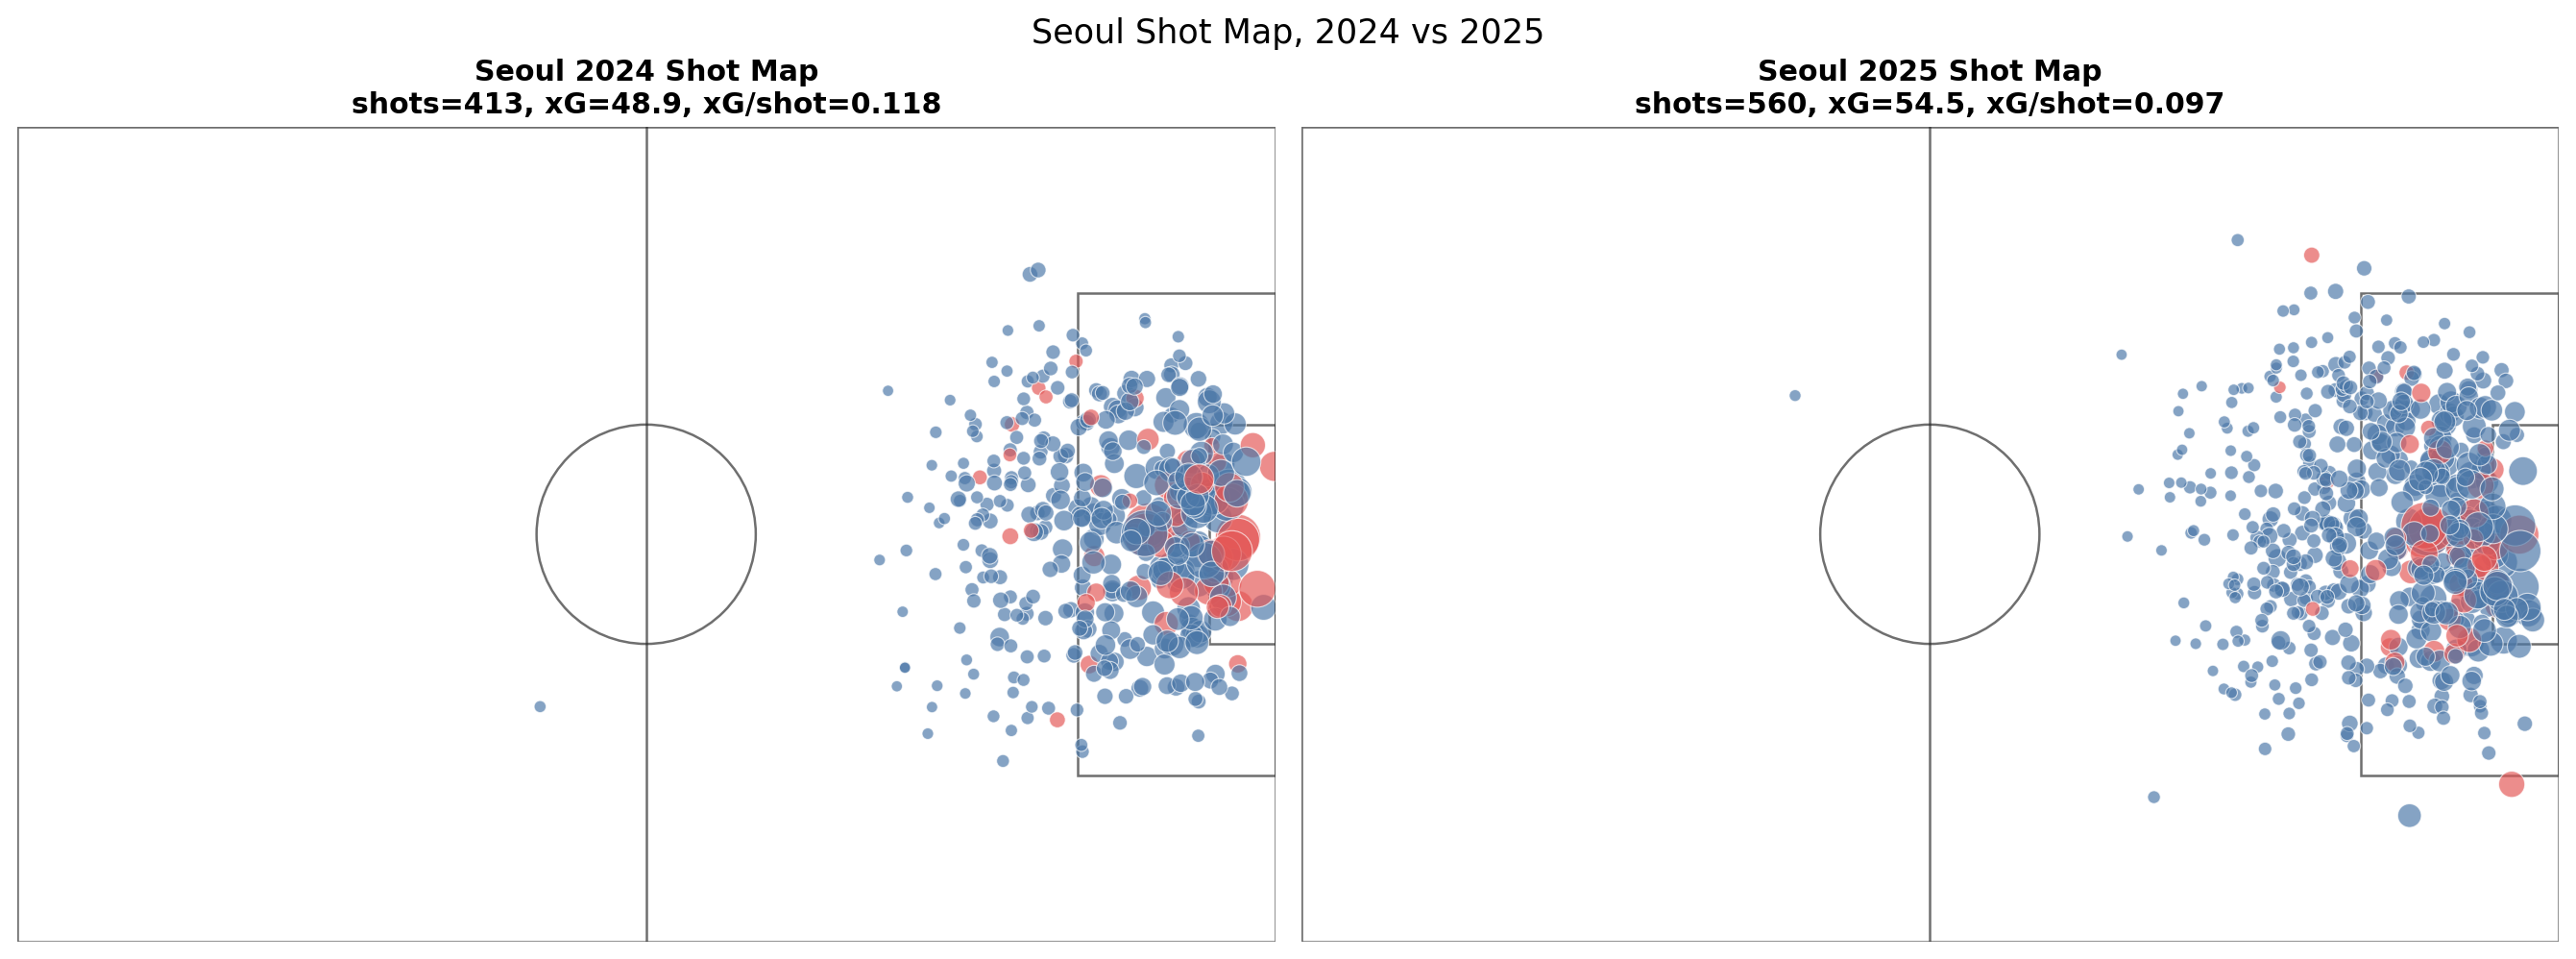
Seoul generated 48.9 xG from 413 shots in 2024. In 2025, they generated 54.5 xG from 560 shots.
Both shot volume and total xG increased, but by very different amounts. Shots increased by approximately 35.6%, while total xG increased by only 11.4%. As a result, xG per shot fell by about 17.8%, from 0.118 to 0.097.
Seoul therefore took more shots and accumulated more total xG in 2025, but the average threat of each shot declined.
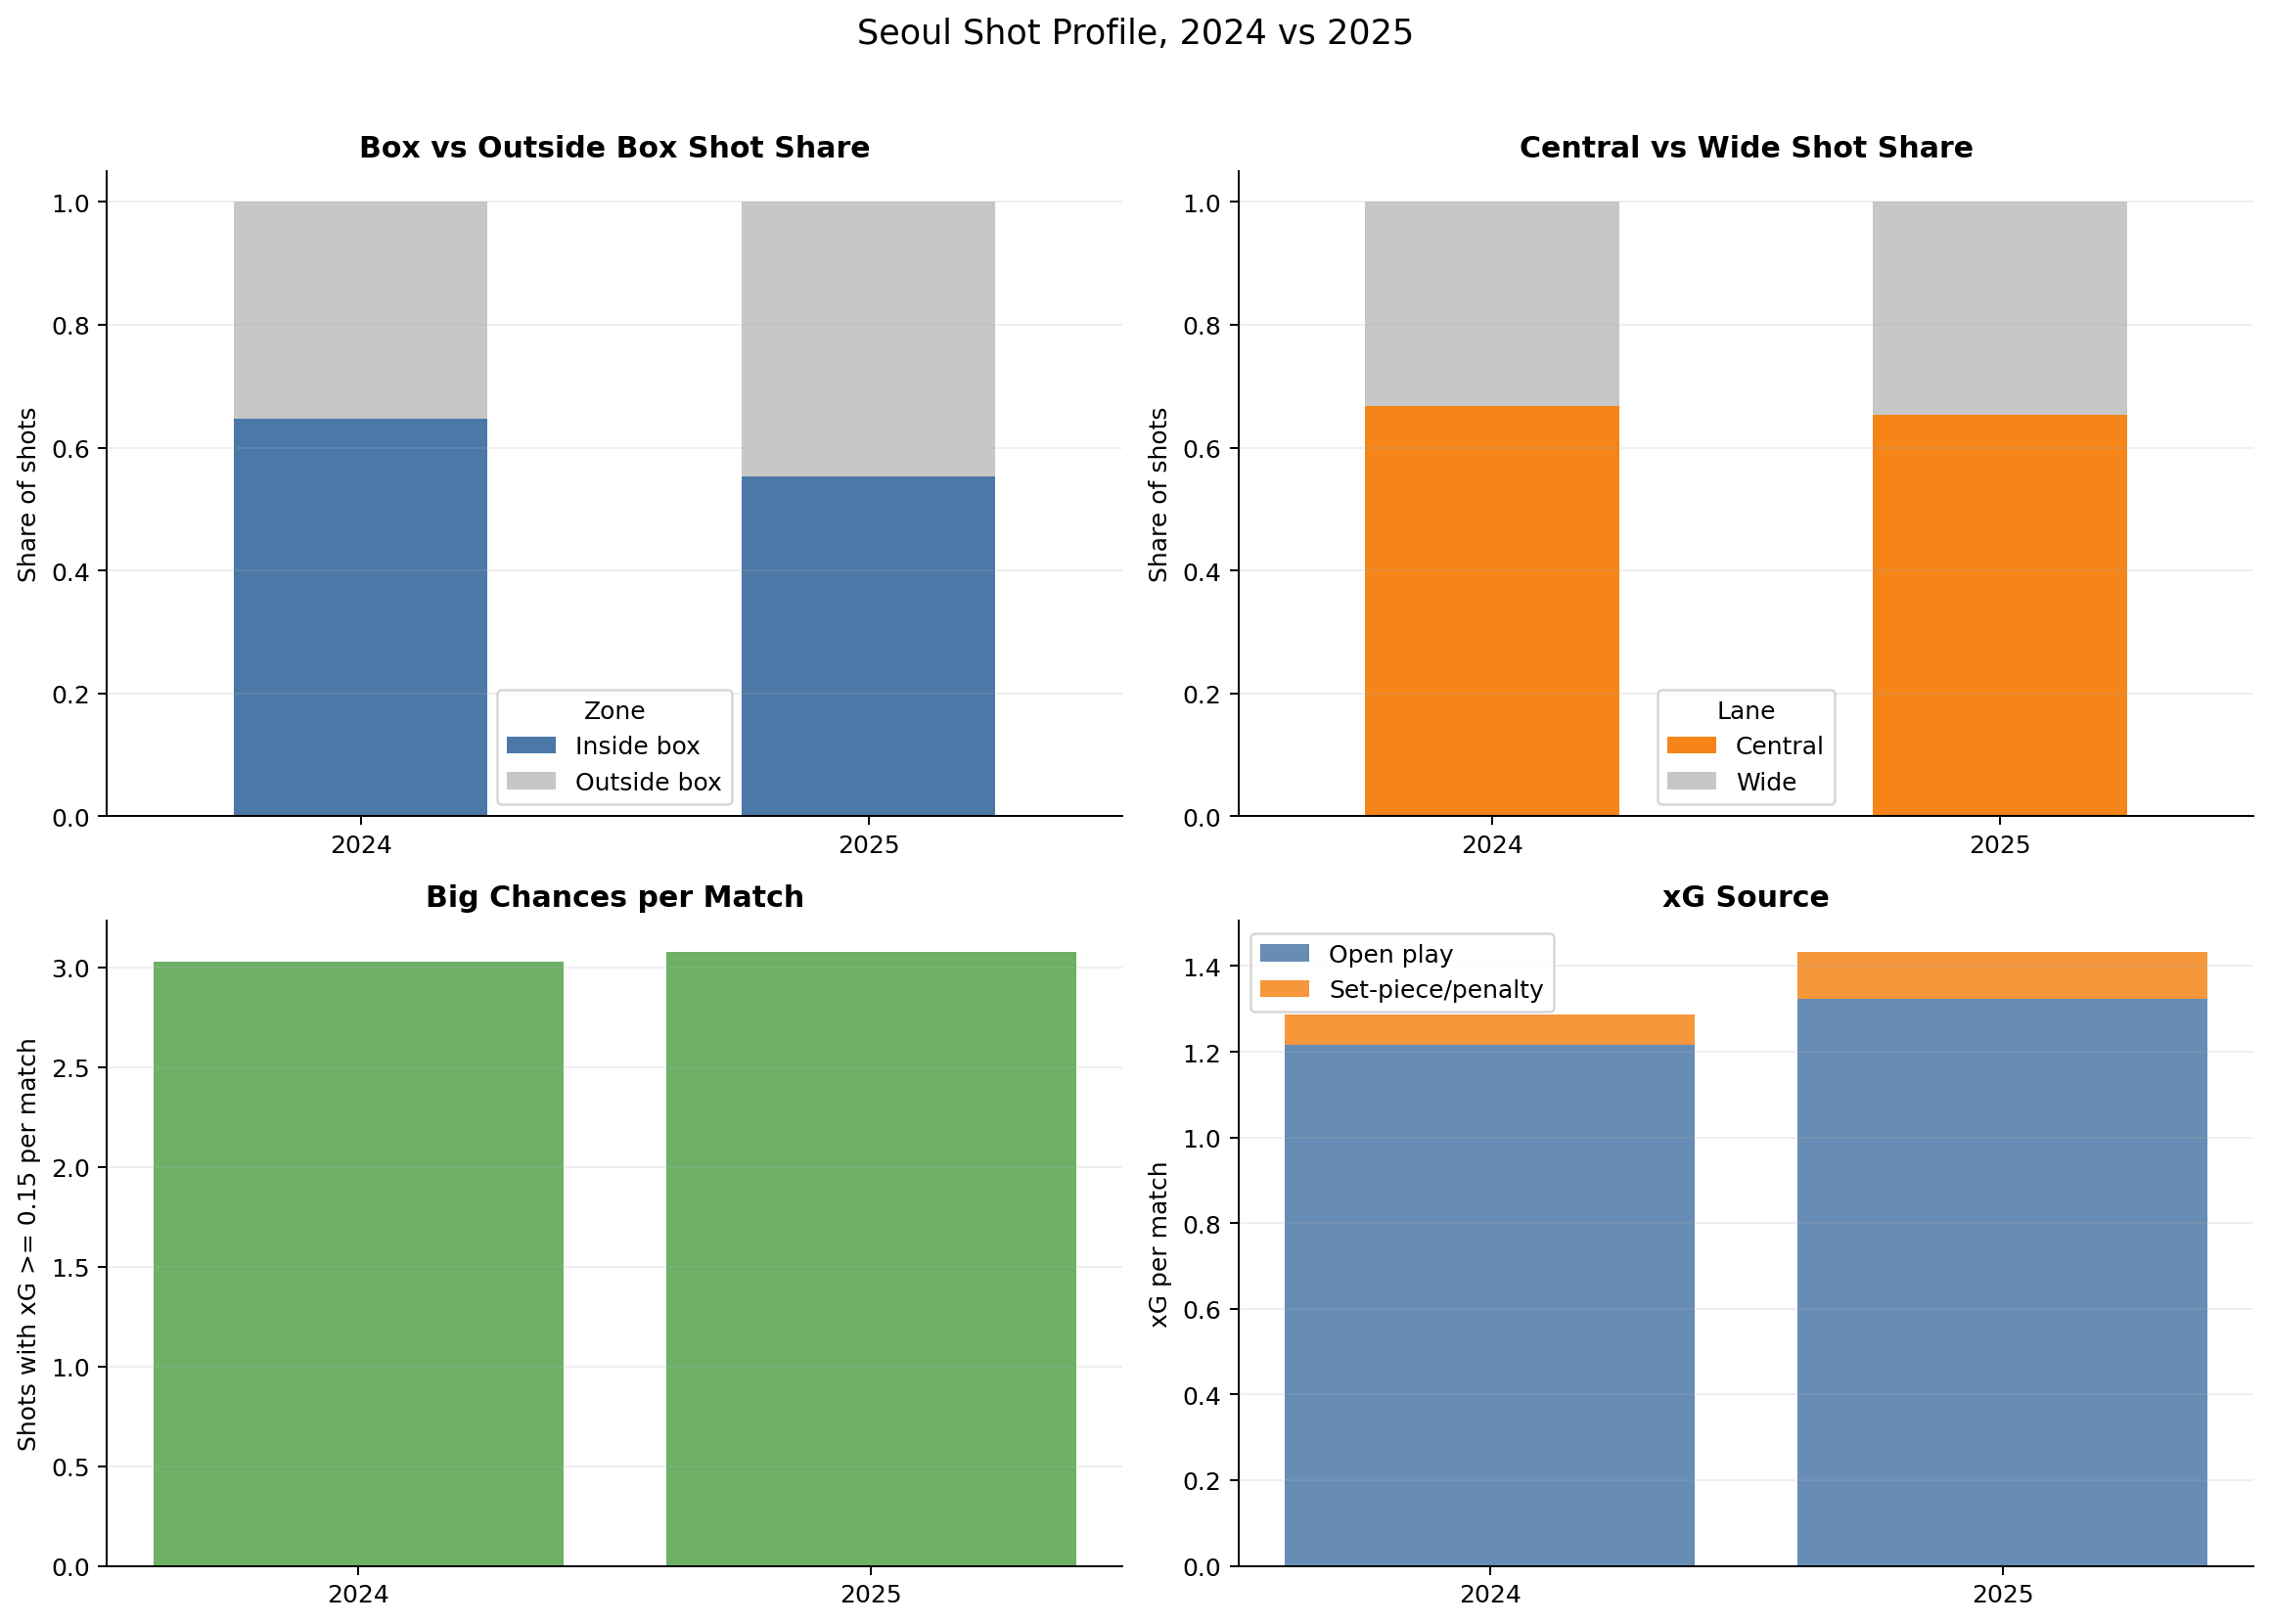
The locations reflect the same change. The share of shots from inside the box dropped sharply, from 64.6% in 2024 to 55.4% in 2025. The share from central areas also declined slightly, from 66.8% to 65.4%. Seoul attempted more shots from a wider range of locations, including outside the box, without increasing their good-location shots at the same rate.
Shots with an xG of at least 0.15, used here as the definition of a high-quality chance, barely changed from 115 to 117. Total shots increased by 147, but the number of major opportunities was effectively unchanged.
Open-play xG rose from 46.2 to 50.3, while set-piece and penalty xG also increased from 2.7 to 4.2. The issue was therefore not the collapse of one particular attacking context. A substantial share of the additional shots simply came from low-probability situations.
Seoul were not a team that failed to create attacks. Both attacking volume and total expected goals increased. But rather than producing many more high-quality chances, they accumulated xG through a much larger number of lower-quality attempts.
Who Generated Seoul's xG?
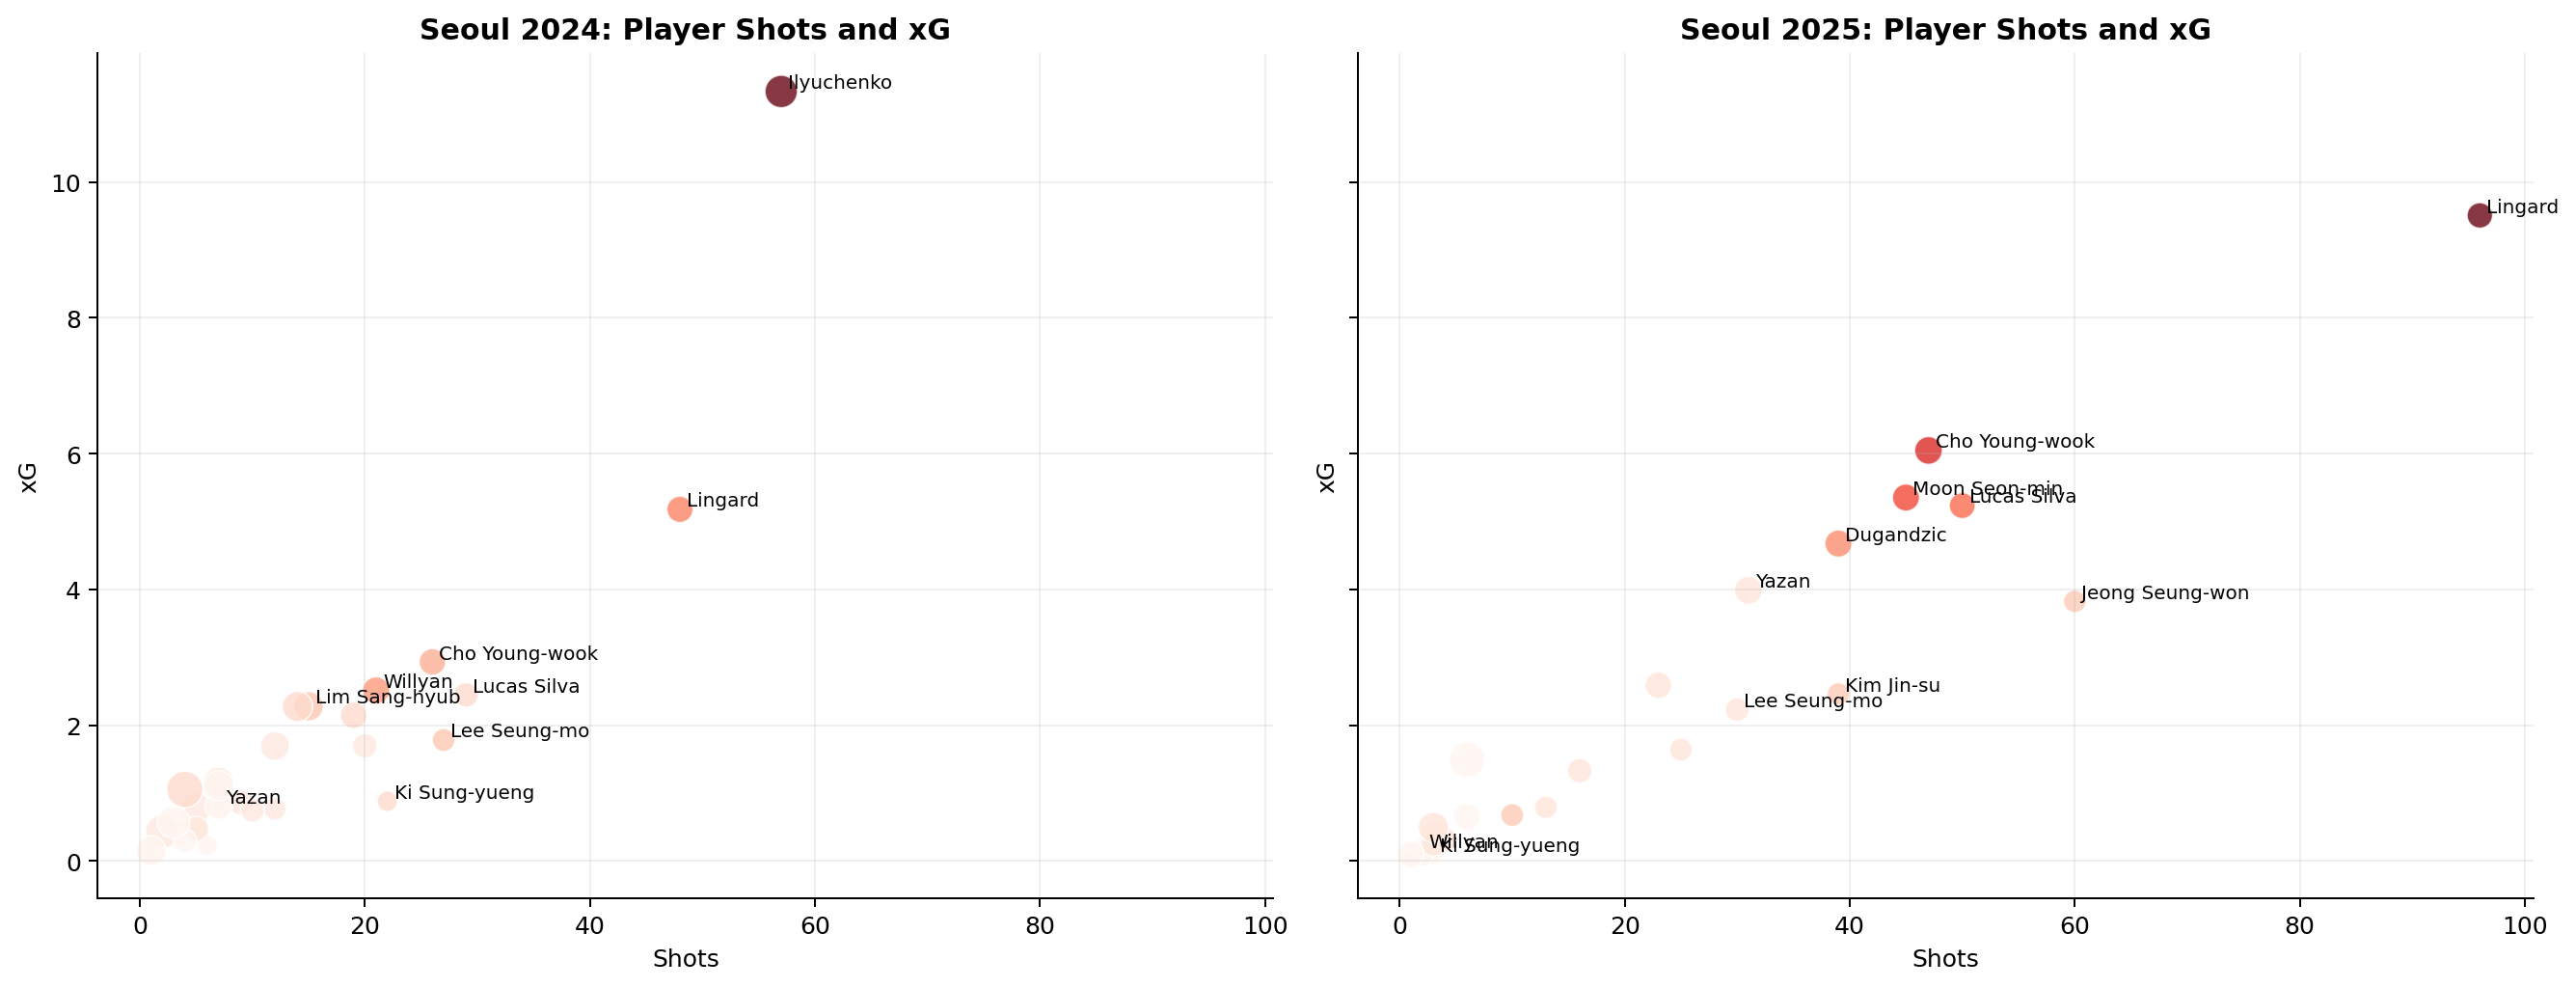
Ilyuchenko was the clearest focal point of Seoul's 2024 attack. He produced 11.33 xG and 14 goals from 57 shots, accounting for about 23.2% of the team's total xG. Lingard followed with 5.18 xG from 48 shots, while Cho Young-wook, Willyan, and Lucas Silva played supporting roles.
In 2025, the center of the attack shifted to Lingard. He recorded 9.51 xG and 10 goals from 96 shots. Cho Young-wook contributed 6.05 xG, Moon Seon-min 5.35, Lucas Silva 5.23, and Dugandzic 4.68.
The leading player's share of team xG fell from 23.2% to 17.4%, suggesting that the attack became less dependent on a single central striker.
That does not mean the attack was evenly distributed across the squad. The top five players' combined share actually rose from 49.9% to 56.6%, while the overall concentration changed little. The attack shifted from one dominant player to a group of core contributors.
Lingard, the leading shooter in 2025, averaged about 0.099 xG per shot, far below Ilyuchenko's 0.199 in 2024. Finishing responsibility was shared among more players, but Seoul had a less distinct focal point repeatedly receiving high-quality chances.
A Comparison: How Did Ulsan Change?
If Seoul show what happens when a strong xG structure fails to become results, Ulsan provide a useful comparison of how the underlying structure itself can change during a season.
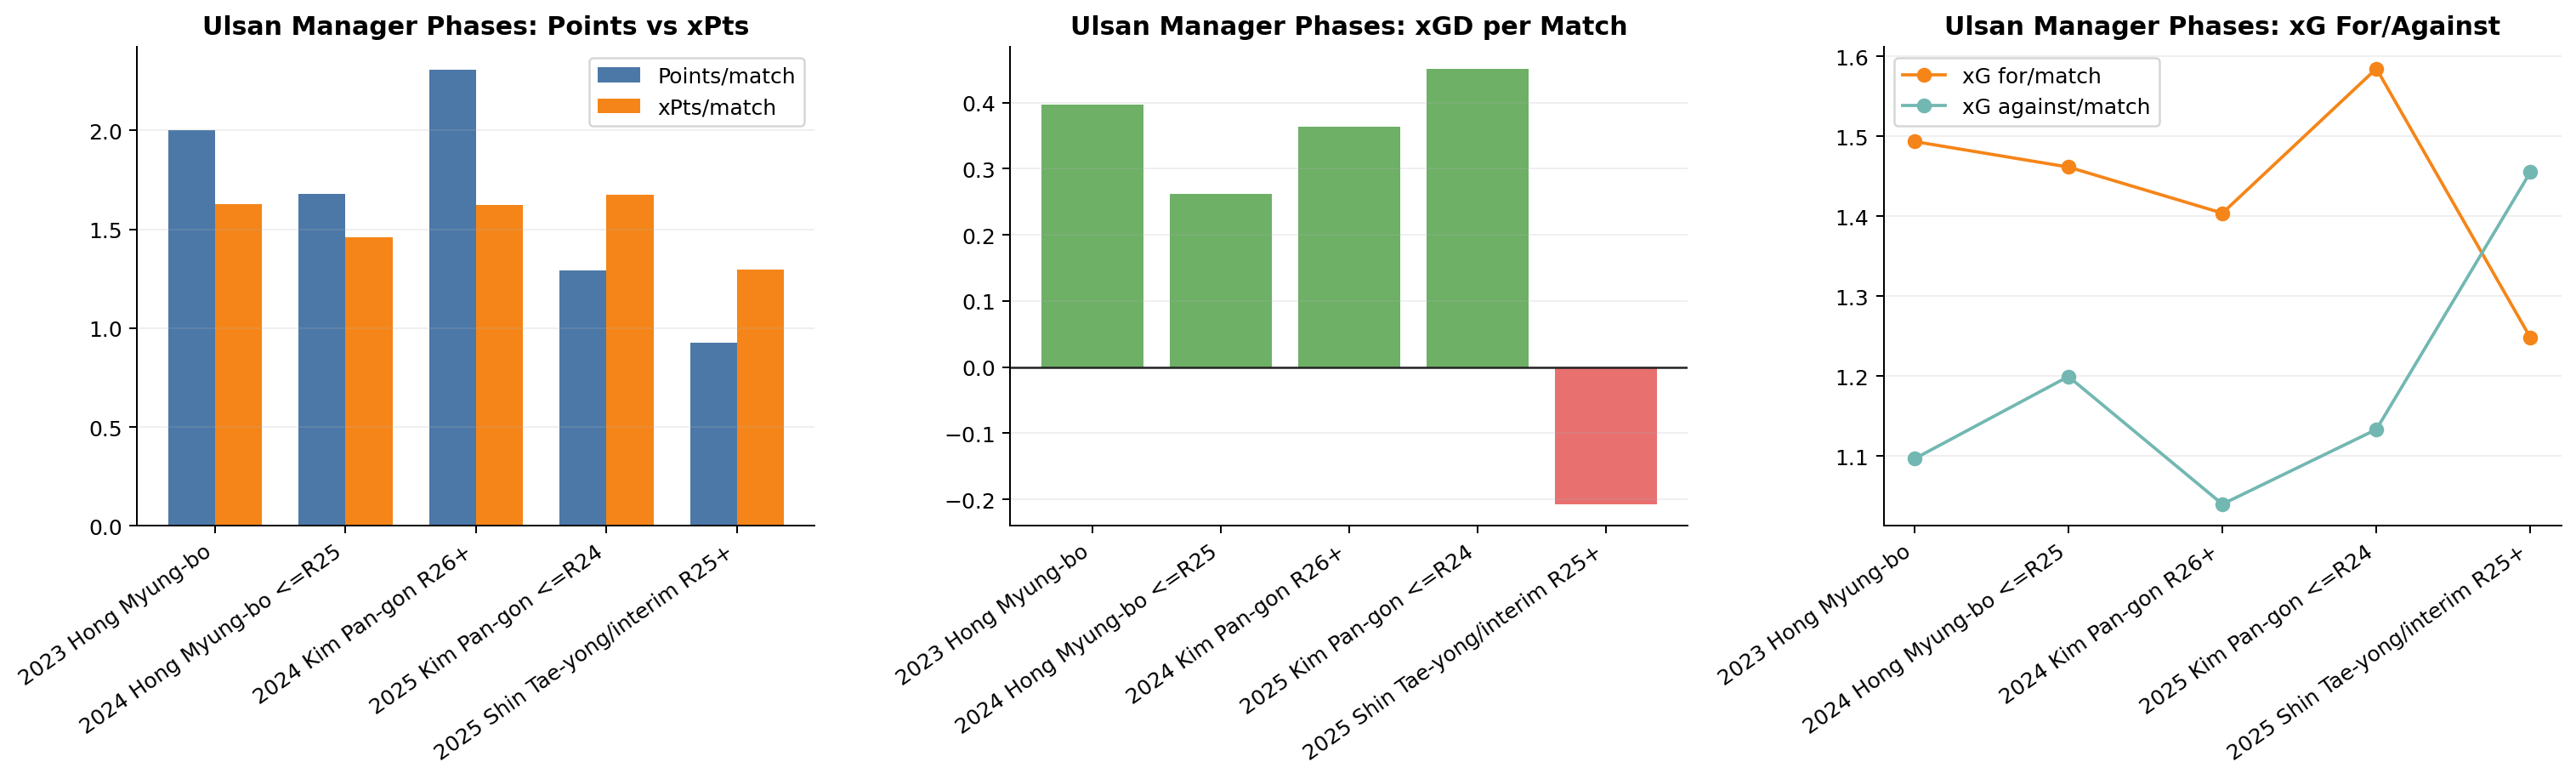
Under Hong Myung-bo in 2023, Ulsan recorded approximately +0.40 xGD per match. In 2024, they remained positive under both Hong (+0.26) and Kim Pan-gon (+0.36), with attacking xG consistently above defensive xGA.
That pattern continued early in 2025. Across rounds 1 to 24 under Kim Pan-gon, Ulsan averaged about 1.59 xG, 1.13 xGA, and +0.45 xGD per match, the strongest xGD of any phase in this comparison.
The clear change came after round 25. During the Shin Tae-yong and interim-coach phase, xG fell from 1.59 to 1.25 per match, while xGA rose from 1.13 to 1.46. xGD therefore dropped sharply from +0.45 to -0.21.
Seoul's strong underlying season failed to translate into results. Ulsan's second half, by contrast, featured simultaneous deterioration in attack and defense. Seoul can be described as a team whose results fell short of its performance; Ulsan's later phase was a period in which the foundation of performance itself weakened.
These coaching-phase comparisons are descriptive, not causal. Schedule strength, opponents, squad composition, and injuries may also contribute to the differences.
Conclusion: Was Kim Gi-dong's Seoul Improving?
It is difficult to describe Seoul's 2025 season simply as a failure.
The league table was disappointing, but Seoul's xG profile was close to the best in the league. They ranked first in both overall xPoints and xGD, and their rolling xGD was strong through the early and middle parts of the season. The structure for creating good chances and limiting opponents was largely working.
The problem was that the performance did not become results. Seoul scored about 4.5 fewer goals than expected and conceded about 13.6 more than their xGA.
That makes 2025 Seoul less a "bad team" than a good-performing team that failed to turn its performance into points.
This interpretation also matters when looking at Seoul in 2026. Through 12 matches as of May 5, 2026, Seoul were first with 26 points. Their model-based total of approximately 18.9 xPoints and fourth-place xGD were not as dominant as the actual results, but the team maintained a positive xG structure while finishing and goal prevention improved substantially.
It is still early in the season, so whether that trend will continue remains uncertain. The clear difference from 2025 is that Seoul's performances are now being converted into actual points.
Questions and collaboration proposals are welcome at thedatadribblers@gmail.com.